|
Download Data (XLS File) |
|
||||||||
|
||||||||
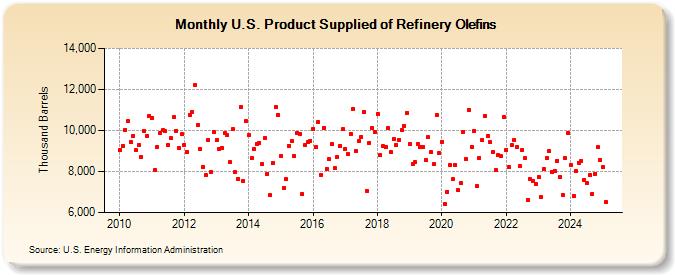
| U.S. Product Supplied of Refinery Olefins (Thousand Barrels) | ||||||||
| Year | Jan | Feb | Mar | Apr | May | Jun | Jul | Aug | Sep | Oct | Nov | Dec |
|---|---|---|---|---|---|---|---|---|---|---|---|---|
| 2010 | 9,026 | 9,260 | 10,041 | 10,439 | 9,436 | 9,755 | 9,032 | 9,289 | 8,719 | 9,974 | 9,751 | 10,714 |
| 2011 | 10,632 | 8,063 | 9,215 | 9,854 | 10,007 | 9,965 | 9,269 | 9,619 | 10,643 | 9,994 | 9,146 | 9,808 |
| 2012 | 9,304 | 8,947 | 10,763 | 10,900 | 12,195 | 10,274 | 9,101 | 8,232 | 7,810 | 9,541 | 7,985 | 9,930 |
| 2013 | 9,517 | 9,099 | 9,163 | 9,857 | 9,772 | 8,441 | 10,049 | 7,963 | 7,659 | 11,141 | 7,527 | 10,438 |
| 2014 | 9,775 | 8,636 | 9,102 | 9,349 | 9,395 | 8,366 | 9,643 | 7,868 | 6,854 | 8,419 | 11,147 | 10,761 |
| 2015 | 8,748 | 7,190 | 7,633 | 9,260 | 9,469 | 8,745 | 9,855 | 9,837 | 6,912 | 9,285 | 9,429 | 9,508 |
| 2016 | 10,081 | 9,205 | 10,404 | 7,832 | 10,134 | 8,139 | 8,600 | 9,330 | 8,166 | 8,696 | 9,247 | 10,056 |
| 2017 | 9,086 | 8,831 | 9,851 | 11,035 | 8,981 | 9,482 | 9,702 | 10,917 | 7,063 | 9,406 | 10,126 | 9,917 |
| 2018 | 10,808 | 8,809 | 9,220 | 9,187 | 10,097 | 8,940 | 9,569 | 9,301 | 9,555 | 10,014 | 10,212 | 10,873 |
| 2019 | 9,358 | 8,388 | 8,448 | 9,350 | 9,177 | 9,191 | 8,565 | 9,659 | 8,934 | 8,343 | 10,769 | 8,919 |
| 2020 | 9,462 | 6,434 | 7,024 | 8,317 | 7,621 | 8,310 | 7,085 | 7,422 | 9,927 | 8,618 | 11,009 | 9,202 |
| 2021 | 9,995 | 7,270 | 8,675 | 9,531 | 10,726 | 9,741 | 9,423 | 8,935 | 8,065 | 8,787 | 8,747 | 10,681 |
| 2022 | 9,068 | 8,214 | 9,300 | 9,533 | 9,212 | 8,250 | 9,053 | 8,639 | 6,620 | 7,620 | 7,522 | 7,410 |
| 2023 | 7,718 | 6,746 | 8,118 | 8,656 | 8,985 | 7,984 | 8,027 | 8,530 | 7,746 | 6,878 | 8,645 | 9,891 |
| 2024 | 8,307 | 6,830 | 8,008 | 8,430 | 8,523 | 7,610 | 7,419 | 7,851 | 6,926 | 7,895 | 9,173 | 8,575 |
| 2025 | 8,217 | 6,519 | 6,923 | 6,993 | ||||||||
| - = No Data Reported; -- = Not Applicable; NA = Not Available; W = Withheld to avoid disclosure of individual company data. |
| Release Date: 6/30/2025 |
| Next Release Date: 7/31/2025 |