|
Download Data (XLS File) |
|
||||||||
|
||||||||
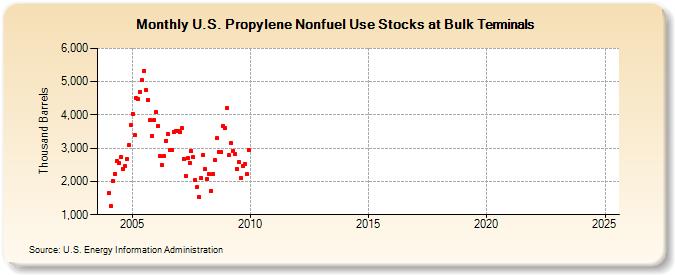
| U.S. Propylene Nonfuel Use Stocks at Bulk Terminals (Thousand Barrels) | ||||||||
| Year | Jan | Feb | Mar | Apr | May | Jun | Jul | Aug | Sep | Oct | Nov | Dec |
|---|---|---|---|---|---|---|---|---|---|---|---|---|
| 2004 | 1,651 | 1,255 | 2,007 | 2,230 | 2,622 | 2,564 | 2,722 | 2,377 | 2,463 | 2,667 | 3,084 | 3,707 |
| 2005 | 4,031 | 3,384 | 4,508 | 4,471 | 4,699 | 5,049 | 5,330 | 4,754 | 4,448 | 3,854 | 3,368 | 3,859 |
| 2006 | 4,087 | 3,680 | 2,764 | 2,491 | 2,753 | 3,228 | 3,429 | 2,939 | 2,958 | 3,487 | 3,511 | 3,513 |
| 2007 | 3,478 | 3,592 | 2,681 | 2,175 | 2,696 | 2,569 | 2,916 | 2,736 | 2,038 | 1,833 | 1,526 | 2,111 |
| 2008 | 2,797 | 2,365 | 2,076 | 2,220 | 1,725 | 2,229 | 2,637 | 3,294 | 2,880 | 2,888 | 3,671 | 3,594 |
| 2009 | 4,194 | 2,782 | 3,153 | 2,910 | 2,830 | 2,385 | 2,591 | 2,116 | 2,479 | 2,525 | 2,212 | 2,958 |
| 2010 | -- | -- | -- | -- | -- | -- | -- | -- | -- | -- | -- | -- |
| 2011 | -- | -- | -- | -- | -- | -- | -- | -- | -- | -- | -- | -- |
| 2012 | -- | -- | -- | -- | -- | -- | -- | -- | -- | -- | -- | -- |
| 2013 | -- | -- | -- | -- | -- | -- | -- | -- | -- | -- | -- | -- |
| 2014 | -- | -- | -- | -- | -- | -- | -- | -- | -- | -- | -- | -- |
| 2015 | -- | -- | -- | -- | -- | -- | -- | -- | -- | -- | -- | -- |
| 2016 | -- | -- | -- | -- | -- | -- | -- | -- | -- | -- | -- | -- |
| 2017 | 3,654 | 2,419 | 2,337 | 3,112 | 2,507 | 2,623 | 2,820 | 3,527 | 3,191 | 2,609 | 2,700 | |
| 2018 | -- | -- | -- | -- | -- | -- | -- | -- | -- | -- | -- | -- |
| 2019 | -- | -- | -- | -- | -- | -- | -- | -- | -- | -- | -- | |
| 2020 | -- | -- | -- | -- | -- | -- | -- | -- | -- | -- | -- | -- |
| 2021 | -- | -- | -- | -- | -- | -- | -- | -- | -- | -- | -- | |
| 2022 | -- | -- | -- | -- | -- | -- | -- | -- | -- | -- | -- | -- |
| 2023 | -- | -- | -- | -- | -- | -- | -- | -- | -- | -- | -- | -- |
| 2024 | -- | |||||||||||
| - = No Data Reported; -- = Not Applicable; NA = Not Available; W = Withheld to avoid disclosure of individual company data. |
| Release Date: 3/29/2024 |
| Next Release Date: 4/30/2024 |