|
Download Data (XLS File) |
|
||||||||
|
||||||||
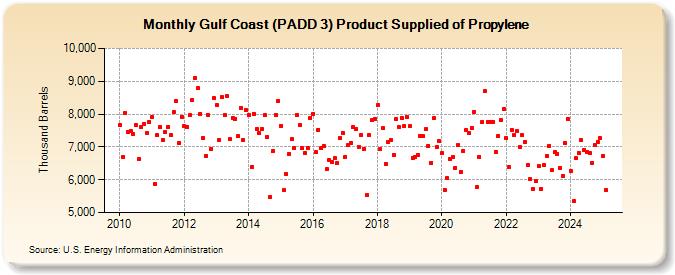
| Gulf Coast (PADD 3) Product Supplied of Propylene (Thousand Barrels) | ||||||||
| Year | Jan | Feb | Mar | Apr | May | Jun | Jul | Aug | Sep | Oct | Nov | Dec |
|---|---|---|---|---|---|---|---|---|---|---|---|---|
| 2010 | 7,673 | 6,697 | 8,031 | 7,457 | 7,485 | 7,398 | 7,653 | 6,630 | 7,609 | 7,712 | 7,415 | 7,766 |
| 2011 | 7,924 | 5,878 | 7,350 | 7,598 | 7,216 | 7,448 | 7,614 | 7,361 | 8,070 | 8,408 | 7,124 | 7,919 |
| 2012 | 7,642 | 7,610 | 7,957 | 8,423 | 9,101 | 8,792 | 8,004 | 7,279 | 6,733 | 7,960 | 6,938 | 8,487 |
| 2013 | 8,277 | 7,223 | 8,513 | 7,969 | 8,541 | 7,233 | 7,889 | 7,862 | 7,330 | 8,191 | 7,215 | 8,111 |
| 2014 | 7,979 | 6,387 | 8,013 | 7,551 | 7,418 | 7,545 | 7,957 | 7,303 | 5,469 | 6,866 | 7,973 | 8,393 |
| 2015 | 7,650 | 5,676 | 6,189 | 6,790 | 7,240 | 6,977 | 7,980 | 7,674 | 6,962 | 6,827 | 6,980 | 7,893 |
| 2016 | 8,015 | 6,832 | 7,524 | 6,963 | 7,024 | 6,319 | 6,600 | 6,537 | 6,658 | 6,499 | 7,261 | 7,429 |
| 2017 | 6,697 | 7,047 | 7,125 | 7,601 | 7,550 | 7,002 | 7,366 | 6,946 | 5,533 | 7,351 | 7,812 | 7,858 |
| 2018 | 8,269 | 6,931 | 7,576 | 6,492 | 7,134 | 7,203 | 6,766 | 7,839 | 7,611 | 7,895 | 7,641 | 7,919 |
| 2019 | 7,622 | 6,673 | 6,687 | 6,761 | 7,322 | 7,321 | 7,542 | 7,035 | 6,524 | 7,873 | 7,002 | 7,171 |
| 2020 | 6,806 | 5,700 | 6,045 | 6,633 | 6,687 | 6,369 | 7,061 | 6,243 | 6,883 | 7,505 | 7,432 | 7,581 |
| 2021 | 8,077 | 5,785 | 6,695 | 7,755 | 8,696 | 7,763 | 7,760 | 7,759 | 6,853 | 7,337 | 7,809 | 8,162 |
| 2022 | 7,266 | 6,386 | 7,516 | 7,355 | 7,480 | 6,987 | 7,354 | 7,158 | 6,461 | 6,021 | 5,724 | 5,947 |
| 2023 | 6,418 | 5,731 | 6,446 | 6,739 | 7,038 | 6,297 | 6,839 | 6,798 | 6,355 | 6,033 | 7,113 | 7,823 |
| 2024 | 6,266 | |||||||||||
| - = No Data Reported; -- = Not Applicable; NA = Not Available; W = Withheld to avoid disclosure of individual company data. |
| Release Date: 3/29/2024 |
| Next Release Date: 4/30/2024 |