|
Download Data (XLS File) |
|
||||||||
|
||||||||
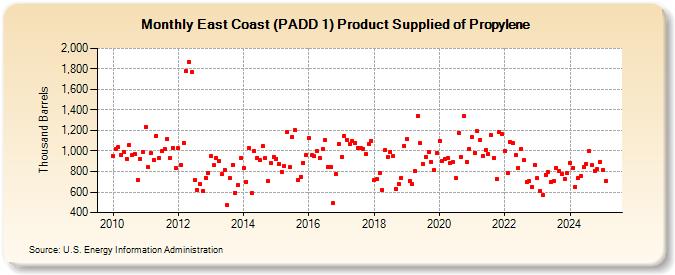
| East Coast (PADD 1) Product Supplied of Propylene (Thousand Barrels) | ||||||||
| Year | Jan | Feb | Mar | Apr | May | Jun | Jul | Aug | Sep | Oct | Nov | Dec |
|---|---|---|---|---|---|---|---|---|---|---|---|---|
| 2010 | 949 | 1,022 | 1,035 | 965 | 995 | 924 | 1,062 | 958 | 973 | 721 | 924 | 994 |
| 2011 | 1,235 | 840 | 977 | 914 | 1,151 | 934 | 997 | 1,015 | 1,116 | 934 | 1,033 | 831 |
| 2012 | 1,028 | 866 | 1,082 | 1,775 | 1,871 | 1,771 | 720 | 624 | 677 | 609 | 740 | 787 |
| 2013 | 950 | 861 | 934 | 899 | 773 | 816 | 471 | 735 | 865 | 594 | 667 | 934 |
| 2014 | 836 | 699 | 1,032 | 587 | 999 | 932 | 914 | 1,047 | 931 | 705 | 883 | 944 |
| 2015 | 926 | 875 | 800 | 856 | 1,187 | 841 | 1,138 | 1,200 | 713 | 749 | 883 | 962 |
| 2016 | 1,127 | 957 | 947 | 997 | 930 | 1,016 | 1,110 | 843 | 848 | 490 | 774 | 1,069 |
| 2017 | 946 | 1,147 | 1,109 | 1,068 | 1,098 | 1,082 | 1,033 | 1,026 | 1,024 | 973 | 1,070 | 1,101 |
| 2018 | 715 | 725 | 781 | 620 | 1,005 | 942 | 992 | 947 | 629 | 679 | 738 | 1,053 |
| 2019 | 1,121 | 708 | 677 | 802 | 1,344 | 1,074 | 878 | 945 | 991 | 893 | 811 | 976 |
| 2020 | 1,101 | 907 | 920 | 927 | 883 | 892 | 739 | 1,179 | 941 | 1,340 | 894 | 1,022 |
| 2021 | 1,136 | 985 | 1,192 | 1,109 | 953 | 1,011 | 973 | 1,156 | 934 | 727 | 1,186 | 1,170 |
| 2022 | 999 | 785 | 1,083 | 1,076 | 962 | 838 | 1,022 | 910 | 693 | 708 | 651 | 863 |
| 2023 | 732 | 611 | 568 | 770 | 795 | 693 | 704 | 839 | 806 | 773 | 730 | 786 |
| 2024 | 785 | |||||||||||
| - = No Data Reported; -- = Not Applicable; NA = Not Available; W = Withheld to avoid disclosure of individual company data. |
| Release Date: 3/29/2024 |
| Next Release Date: 4/30/2024 |