|
Download Data (XLS File) |
|
||||||||
|
||||||||
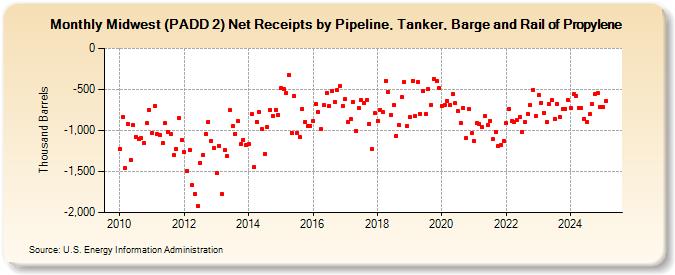
| Midwest (PADD 2) Net Receipts by Pipeline, Tanker, Barge and Rail of Propylene (Thousand Barrels) | ||||||||
| Year | Jan | Feb | Mar | Apr | May | Jun | Jul | Aug | Sep | Oct | Nov | Dec |
|---|---|---|---|---|---|---|---|---|---|---|---|---|
| 2010 | -1,231 | -833 | -1,457 | -919 | -1,356 | -939 | -1,076 | -1,109 | -1,094 | -1,154 | -915 | -752 |
| 2011 | -1,030 | -703 | -1,045 | -1,057 | -1,152 | -912 | -1,016 | -1,038 | -1,303 | -1,222 | -852 | -1,118 |
| 2012 | -1,263 | -1,493 | -1,240 | -1,668 | -1,770 | -1,920 | -1,391 | -1,293 | -1,040 | -892 | -1,125 | -1,217 |
| 2013 | -1,523 | -1,186 | -1,773 | -1,239 | -1,312 | -756 | -951 | -1,039 | -890 | -1,170 | -1,111 | -1,182 |
| 2014 | -1,164 | -805 | -1,449 | -893 | -770 | -987 | -1,285 | -961 | -746 | -826 | -747 | -808 |
| 2015 | -486 | -497 | -544 | -327 | -1,028 | -574 | -1,033 | -1,076 | -740 | -894 | -950 | -941 |
| 2016 | -887 | -678 | -775 | -984 | -693 | -540 | -704 | -514 | -648 | -505 | -463 | -696 |
| 2017 | -617 | -892 | -865 | -649 | -1,005 | -731 | -630 | -671 | -628 | -921 | -1,224 | -792 |
| 2018 | -881 | -750 | -774 | -394 | -531 | -811 | -695 | -1,064 | -939 | -595 | -410 | -945 |
| 2019 | -836 | -394 | -825 | -410 | -797 | -523 | -800 | -495 | -685 | -368 | -395 | -483 |
| 2020 | -697 | -687 | -641 | -684 | -557 | -667 | -761 | -907 | -727 | -1,094 | -744 | -1,034 |
| 2021 | -1,127 | -914 | -921 | -960 | -827 | -934 | -882 | -1,108 | -1,018 | -1,187 | -1,177 | -1,127 |
| 2022 | -914 | -735 | -882 | -896 | -874 | -834 | -1,016 | -901 | -797 | -690 | -504 | -822 |
| 2023 | -570 | -662 | -782 | -903 | -675 | -632 | -857 | -675 | -832 | -743 | -735 | -611 |
| 2024 | -629 | |||||||||||
| - = No Data Reported; -- = Not Applicable; NA = Not Available; W = Withheld to avoid disclosure of individual company data. |
| Release Date: 3/29/2024 |
| Next Release Date: 4/30/2024 |