|
Download Data (XLS File) |
|
||||||||
|
||||||||
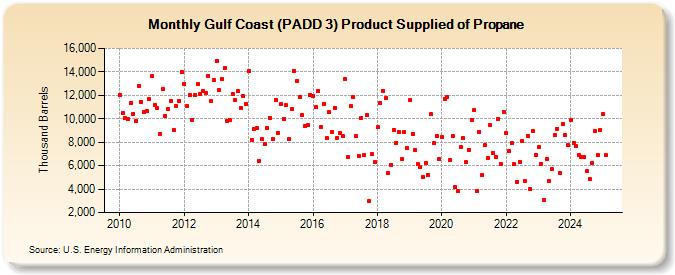
| Gulf Coast (PADD 3) Product Supplied of Propane (Thousand Barrels) | ||||||||
| Year | Jan | Feb | Mar | Apr | May | Jun | Jul | Aug | Sep | Oct | Nov | Dec |
|---|---|---|---|---|---|---|---|---|---|---|---|---|
| 2010 | 12,059 | 10,489 | 10,058 | 9,938 | 11,383 | 10,412 | 9,839 | 12,833 | 11,458 | 10,550 | 10,623 | 11,726 |
| 2011 | 13,603 | 11,163 | 10,906 | 8,720 | 12,508 | 10,236 | 10,858 | 11,533 | 8,999 | 11,075 | 11,537 | 13,965 |
| 2012 | 13,000 | 11,066 | 12,005 | 9,877 | 11,984 | 12,928 | 12,115 | 12,349 | 12,218 | 13,683 | 11,484 | 13,316 |
| 2013 | 14,949 | 12,411 | 13,414 | 14,287 | 9,814 | 9,876 | 12,131 | 11,628 | 12,332 | 10,938 | 11,933 | 11,291 |
| 2014 | 14,046 | 8,175 | 9,139 | 9,186 | 6,402 | 8,241 | 7,848 | 9,217 | 10,089 | 8,242 | 11,618 | 8,799 |
| 2015 | 11,228 | 9,997 | 11,137 | 8,233 | 10,831 | 14,080 | 13,229 | 11,850 | 10,306 | 9,345 | 9,432 | 12,016 |
| 2016 | 11,976 | 10,997 | 12,380 | 9,318 | 11,279 | 8,370 | 10,592 | 8,871 | 10,940 | 8,395 | 8,812 | 8,519 |
| 2017 | 13,379 | 6,728 | 11,060 | 11,825 | 8,500 | 6,796 | 10,072 | 6,943 | 10,321 | 2,955 | 7,026 | 6,294 |
| 2018 | 9,264 | 11,337 | 12,405 | 11,762 | 5,374 | 6,069 | 9,052 | 7,932 | 8,846 | 6,546 | 8,869 | 7,496 |
| 2019 | 11,562 | 8,731 | 7,344 | 6,172 | 5,883 | 5,065 | 6,213 | 5,215 | 10,370 | 7,906 | 8,529 | 6,527 |
| 2020 | 8,434 | 11,709 | 11,880 | 6,479 | 8,567 | 4,175 | 3,842 | 7,600 | 8,319 | 6,283 | 7,376 | 9,884 |
| 2021 | 10,721 | 3,866 | 8,874 | 5,234 | 7,733 | 6,648 | 9,474 | 7,066 | 6,752 | 10,012 | 6,105 | 10,602 |
| 2022 | 8,754 | 7,209 | 7,929 | 6,099 | 4,608 | 6,315 | 8,132 | 4,653 | 8,559 | 4,022 | 8,982 | 6,898 |
| 2023 | 5,984 | 5,724 | 4,855 | 8,110 | 5,664 | 7,237 | 8,478 | 9,163 | 5,793 | 10,325 | 7,750 | 6,467 |
| 2024 | 9,942 | |||||||||||
| - = No Data Reported; -- = Not Applicable; NA = Not Available; W = Withheld to avoid disclosure of individual company data. |
| Release Date: 3/29/2024 |
| Next Release Date: 4/30/2024 |