|
Download Data (XLS File) |
|
||||||||
|
||||||||
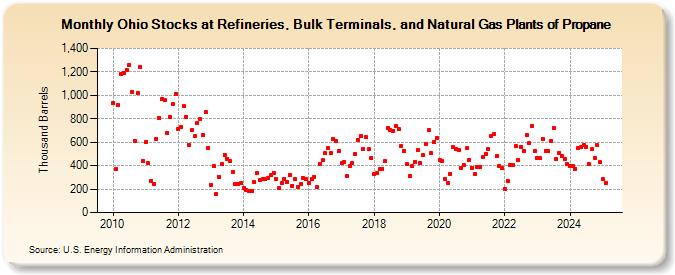
| Ohio Stocks at Refineries, Bulk Terminals, and Natural Gas Plants of Propane (Thousand Barrels) | ||||||||
| Year | Jan | Feb | Mar | Apr | May | Jun | Jul | Aug | Sep | Oct | Nov | Dec |
|---|---|---|---|---|---|---|---|---|---|---|---|---|
| 2010 | 932 | 368 | 914 | 1,183 | 1,194 | 1,212 | 1,259 | 1,025 | 611 | 1,019 | 1,242 | 441 |
| 2011 | 604 | 420 | 268 | 246 | 629 | 805 | 972 | 956 | 680 | 814 | 925 | 1,012 |
| 2012 | 715 | 730 | 905 | 819 | 572 | 702 | 650 | 761 | 796 | 659 | 854 | 553 |
| 2013 | 239 | 396 | 162 | 302 | 414 | 492 | 461 | 443 | 349 | 241 | 241 | 249 |
| 2014 | 209 | 191 | 181 | 184 | 262 | 337 | 275 | 287 | 287 | 295 | 318 | 341 |
| 2015 | 288 | 208 | 248 | 286 | 264 | 324 | 227 | 285 | 220 | 243 | 293 | 284 |
| 2016 | 255 | 288 | 304 | 215 | 418 | 445 | 510 | 549 | 510 | 628 | 606 | 529 |
| 2017 | 422 | 431 | 315 | 394 | 422 | 502 | 620 | 651 | 545 | 641 | 540 | 467 |
| 2018 | 330 | 335 | 370 | 372 | 437 | 724 | 706 | 696 | 734 | 709 | 566 | 529 |
| 2019 | 412 | 313 | 398 | 435 | 530 | 423 | 490 | 587 | 701 | 507 | 601 | 637 |
| 2020 | 450 | 438 | 285 | 252 | 333 | 557 | 540 | 537 | 380 | 403 | 547 | 452 |
| 2021 | 384 | 331 | 386 | 391 | 475 | 503 | 539 | 655 | 670 | 481 | 401 | 380 |
| 2022 | 202 | 272 | 403 | 407 | 564 | 449 | 563 | 528 | 664 | 589 | 738 | 522 |
| 2023 | 468 | 465 | 631 | 527 | 523 | 607 | 724 | 458 | 509 | 483 | 453 | 410 |
| 2024 | 395 | |||||||||||
| - = No Data Reported; -- = Not Applicable; NA = Not Available; W = Withheld to avoid disclosure of individual company data. |
| Release Date: 3/29/2024 |
| Next Release Date: 4/30/2024 |