|
Download Data (XLS File) |
|
||||||||
|
||||||||
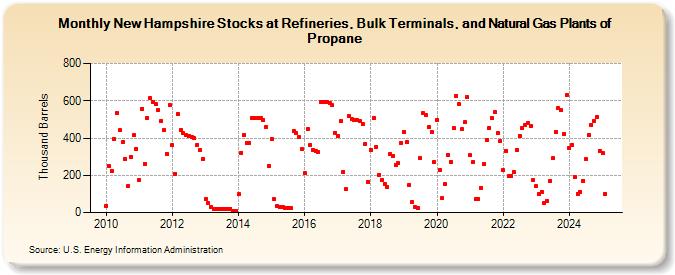
| New Hampshire Stocks at Refineries, Bulk Terminals, and Natural Gas Plants of Propane (Thousand Barrels) | ||||||||
| Year | Jan | Feb | Mar | Apr | May | Jun | Jul | Aug | Sep | Oct | Nov | Dec |
|---|---|---|---|---|---|---|---|---|---|---|---|---|
| 2010 | 37 | 250 | 225 | 394 | 534 | 443 | 376 | 288 | 143 | 300 | 414 | 343 |
| 2011 | 176 | 558 | 262 | 508 | 614 | 594 | 580 | 553 | 494 | 441 | 316 | 576 |
| 2012 | 360 | 209 | 531 | 443 | 425 | 416 | 411 | 407 | 398 | 364 | 338 | 290 |
| 2013 | 72 | 52 | 30 | 21 | 21 | 21 | 21 | 21 | 21 | 21 | 10 | 10 |
| 2014 | 97 | 321 | 416 | 375 | 373 | 508 | 508 | 508 | 508 | 497 | 458 | 252 |
| 2015 | 396 | 71 | 35 | 28 | 30 | 27 | 27 | 27 | 438 | 428 | 404 | 339 |
| 2016 | 210 | 447 | 363 | 338 | 328 | 326 | 594 | 595 | 595 | 586 | 575 | 429 |
| 2017 | 409 | 492 | 219 | 125 | 516 | 500 | 496 | 495 | 490 | 473 | 370 | 166 |
| 2018 | 338 | 509 | 353 | 203 | 176 | 152 | 138 | 314 | 301 | 256 | 264 | 375 |
| 2019 | 434 | 377 | 148 | 57 | 30 | 27 | 291 | 534 | 522 | 457 | 434 | 270 |
| 2020 | 496 | 229 | 76 | 151 | 308 | 273 | 456 | 626 | 580 | 447 | 484 | 621 |
| 2021 | 307 | 271 | 72 | 74 | 134 | 260 | 391 | 454 | 506 | 538 | 426 | 385 |
| 2022 | 226 | 332 | 194 | 197 | 216 | 336 | 412 | 453 | 471 | 480 | 462 | 173 |
| 2023 | 140 | 99 | 113 | 52 | 63 | 169 | 291 | 434 | 560 | 548 | 422 | 631 |
| 2024 | 345 | |||||||||||
| - = No Data Reported; -- = Not Applicable; NA = Not Available; W = Withheld to avoid disclosure of individual company data. |
| Release Date: 3/29/2024 |
| Next Release Date: 4/30/2024 |