|
Download Data (XLS File) |
|
||||||||
|
||||||||
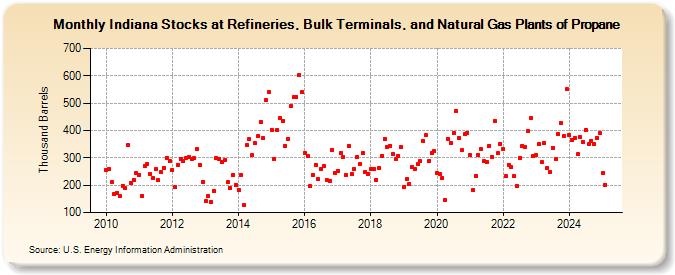
| Indiana Stocks at Refineries, Bulk Terminals, and Natural Gas Plants of Propane (Thousand Barrels) | ||||||||
| Year | Jan | Feb | Mar | Apr | May | Jun | Jul | Aug | Sep | Oct | Nov | Dec |
|---|---|---|---|---|---|---|---|---|---|---|---|---|
| 2010 | 257 | 259 | 211 | 167 | 172 | 159 | 198 | 189 | 346 | 208 | 220 | 244 |
| 2011 | 239 | 162 | 271 | 278 | 242 | 226 | 259 | 218 | 247 | 264 | 301 | 288 |
| 2012 | 256 | 192 | 275 | 296 | 290 | 300 | 303 | 295 | 298 | 331 | 273 | 213 |
| 2013 | 141 | 160 | 139 | 180 | 298 | 296 | 284 | 291 | 211 | 190 | 239 | 201 |
| 2014 | 183 | 237 | 126 | 346 | 368 | 309 | 353 | 379 | 431 | 372 | 511 | 539 |
| 2015 | 403 | 295 | 402 | 444 | 434 | 345 | 369 | 488 | 521 | 523 | 602 | 539 |
| 2016 | 319 | 306 | 196 | 239 | 275 | 221 | 261 | 271 | 218 | 217 | 328 | 245 |
| 2017 | 253 | 318 | 302 | 237 | 345 | 241 | 261 | 303 | 277 | 316 | 248 | 241 |
| 2018 | 259 | 261 | 219 | 262 | 308 | 369 | 338 | 345 | 315 | 294 | 308 | 339 |
| 2019 | 195 | 222 | 206 | 266 | 260 | 277 | 287 | 361 | 382 | 287 | 318 | 324 |
| 2020 | 244 | 241 | 228 | 146 | 369 | 356 | 392 | 471 | 373 | 327 | 386 | 392 |
| 2021 | 310 | 183 | 234 | 312 | 331 | 287 | 286 | 344 | 304 | 435 | 316 | 352 |
| 2022 | 331 | 232 | 274 | 266 | 232 | 198 | 301 | 344 | 340 | 397 | 444 | 305 |
| 2023 | 311 | 350 | 283 | 353 | 264 | 249 | 337 | 294 | 388 | 429 | 378 | 550 |
| 2024 | 383 | 366 | 373 | 313 | ||||||||
| - = No Data Reported; -- = Not Applicable; NA = Not Available; W = Withheld to avoid disclosure of individual company data. |
| Release Date: 6/28/2024 |
| Next Release Date: 7/31/2024 |