|
Download Data (XLS File) |
|
||||||||
|
||||||||
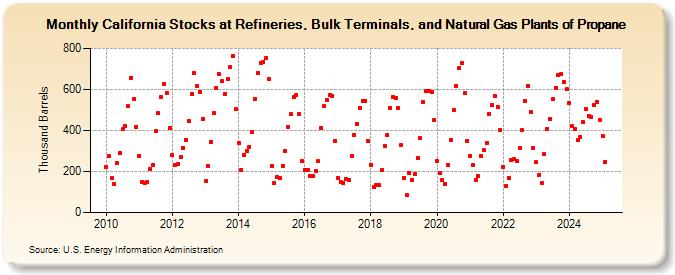
| California Stocks at Refineries, Bulk Terminals, and Natural Gas Plants of Propane (Thousand Barrels) | ||||||||
| Year | Jan | Feb | Mar | Apr | May | Jun | Jul | Aug | Sep | Oct | Nov | Dec |
|---|---|---|---|---|---|---|---|---|---|---|---|---|
| 2010 | 220 | 274 | 168 | 137 | 240 | 289 | 407 | 424 | 518 | 658 | 555 | 416 |
| 2011 | 276 | 151 | 142 | 150 | 211 | 230 | 397 | 485 | 563 | 626 | 584 | 412 |
| 2012 | 279 | 231 | 237 | 269 | 316 | 353 | 446 | 577 | 679 | 617 | 589 | 454 |
| 2013 | 152 | 229 | 344 | 483 | 608 | 673 | 641 | 578 | 652 | 709 | 762 | 504 |
| 2014 | 338 | 208 | 282 | 299 | 321 | 391 | 554 | 681 | 729 | 734 | 751 | 653 |
| 2015 | 225 | 143 | 172 | 169 | 228 | 301 | 417 | 478 | 561 | 574 | 480 | 252 |
| 2016 | 209 | 209 | 179 | 178 | 202 | 250 | 414 | 518 | 548 | 574 | 569 | 351 |
| 2017 | 167 | 151 | 145 | 165 | 160 | 274 | 380 | 432 | 509 | 546 | 545 | 348 |
| 2018 | 233 | 123 | 134 | 133 | 207 | 325 | 377 | 508 | 562 | 560 | 510 | 327 |
| 2019 | 169 | 85 | 193 | 160 | 190 | 265 | 364 | 538 | 592 | 594 | 586 | 449 |
| 2020 | 249 | 193 | 157 | 141 | 234 | 354 | 502 | 618 | 703 | 727 | 583 | 351 |
| 2021 | 274 | 230 | 160 | 176 | 277 | 304 | 341 | 481 | 524 | 567 | 516 | 401 |
| 2022 | 224 | 129 | 170 | 255 | 260 | 249 | 313 | 401 | 542 | 615 | 490 | 316 |
| 2023 | 244 | 185 | 143 | 285 | 407 | 454 | 553 | 608 | 668 | 673 | 638 | 602 |
| 2024 | 532 | |||||||||||
| - = No Data Reported; -- = Not Applicable; NA = Not Available; W = Withheld to avoid disclosure of individual company data. |
| Release Date: 3/29/2024 |
| Next Release Date: 4/30/2024 |