|
Download Data (XLS File) |
|
||||||||
|
||||||||
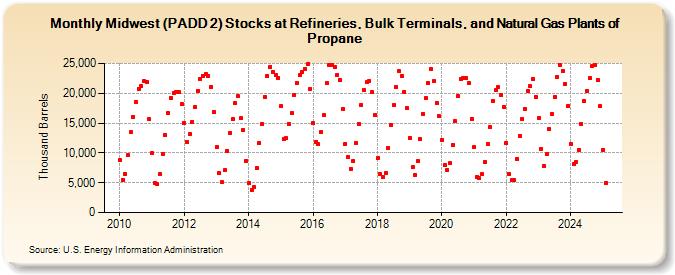
| Midwest (PADD 2) Stocks at Refineries, Bulk Terminals, and Natural Gas Plants of Propane (Thousand Barrels) | ||||||||
| Year | Jan | Feb | Mar | Apr | May | Jun | Jul | Aug | Sep | Oct | Nov | Dec |
|---|---|---|---|---|---|---|---|---|---|---|---|---|
| 2010 | 8,760 | 5,480 | 6,455 | 9,609 | 13,453 | 16,108 | 18,578 | 20,772 | 21,189 | 22,099 | 21,944 | 15,625 |
| 2011 | 9,917 | 4,972 | 4,714 | 6,389 | 9,787 | 13,014 | 16,690 | 19,180 | 20,026 | 20,271 | 20,154 | 18,186 |
| 2012 | 14,988 | 11,912 | 13,109 | 15,256 | 17,732 | 20,459 | 22,423 | 22,973 | 23,315 | 22,934 | 21,104 | 16,924 |
| 2013 | 10,966 | 6,561 | 5,082 | 7,090 | 10,387 | 13,370 | 15,652 | 18,310 | 19,489 | 15,802 | 13,834 | 8,698 |
| 2014 | 4,952 | 3,827 | 4,245 | 7,467 | 11,710 | 14,836 | 19,415 | 22,832 | 24,453 | 23,598 | 23,095 | 22,610 |
| 2015 | 17,823 | 12,260 | 12,452 | 14,860 | 16,662 | 19,770 | 21,777 | 23,020 | 23,614 | 24,158 | 24,947 | 20,745 |
| 2016 | 14,975 | 11,865 | 11,427 | 13,428 | 16,335 | 21,720 | 24,826 | 24,799 | 24,372 | 23,105 | 22,241 | 17,338 |
| 2017 | 11,544 | 9,337 | 7,385 | 8,658 | 11,702 | 14,881 | 18,061 | 20,500 | 21,852 | 22,035 | 20,201 | 16,341 |
| 2018 | 9,145 | 6,433 | 6,042 | 6,607 | 10,864 | 14,674 | 18,008 | 21,032 | 23,686 | 22,956 | 20,290 | 17,460 |
| 2019 | 12,586 | 7,577 | 6,362 | 8,669 | 12,334 | 16,565 | 19,217 | 21,730 | 24,000 | 22,095 | 18,441 | 16,140 |
| 2020 | 12,176 | 7,938 | 7,140 | 8,256 | 11,409 | 15,346 | 19,616 | 22,337 | 22,496 | 22,511 | 21,756 | 15,754 |
| 2021 | 10,913 | 5,965 | 5,774 | 6,405 | 8,461 | 11,475 | 14,358 | 18,705 | 20,529 | 21,011 | 19,715 | 17,727 |
| 2022 | 11,628 | 6,504 | 5,437 | 5,380 | 8,957 | 12,875 | 15,714 | 17,449 | 20,345 | 21,160 | 22,362 | 19,400 |
| 2023 | 15,628 | 10,583 | 7,841 | 9,725 | 13,909 | 16,416 | 19,347 | 22,599 | 24,660 | 23,722 | 21,563 | 17,880 |
| 2024 | 11,466 | |||||||||||
| - = No Data Reported; -- = Not Applicable; NA = Not Available; W = Withheld to avoid disclosure of individual company data. |
| Release Date: 3/29/2024 |
| Next Release Date: 4/30/2024 |