|
Download Data (XLS File) |
|
||||||||
|
||||||||
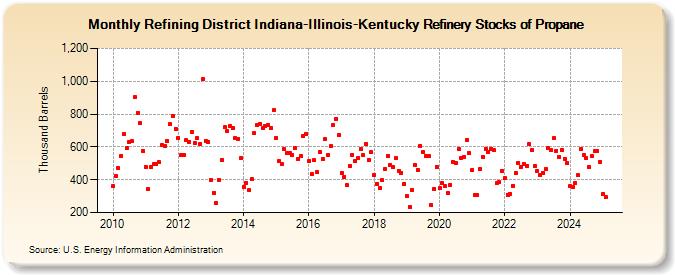
| Refining District Indiana-Illinois-Kentucky Refinery Stocks of Propane (Thousand Barrels) | ||||||||
| Year | Jan | Feb | Mar | Apr | May | Jun | Jul | Aug | Sep | Oct | Nov | Dec |
|---|---|---|---|---|---|---|---|---|---|---|---|---|
| 2010 | 360 | 424 | 470 | 546 | 681 | 593 | 631 | 634 | 903 | 809 | 744 | 574 |
| 2011 | 478 | 342 | 477 | 495 | 497 | 506 | 611 | 607 | 635 | 737 | 786 | 712 |
| 2012 | 655 | 550 | 552 | 640 | 631 | 692 | 623 | 652 | 618 | 1,011 | 638 | 632 |
| 2013 | 399 | 321 | 256 | 399 | 523 | 719 | 694 | 725 | 713 | 654 | 650 | 530 |
| 2014 | 358 | 381 | 335 | 402 | 683 | 732 | 739 | 716 | 726 | 733 | 718 | 822 |
| 2015 | 655 | 512 | 493 | 585 | 560 | 562 | 552 | 593 | 526 | 543 | 669 | 679 |
| 2016 | 514 | 432 | 518 | 447 | 570 | 528 | 648 | 550 | 605 | 735 | 770 | 672 |
| 2017 | 444 | 419 | 366 | 484 | 551 | 513 | 531 | 586 | 549 | 620 | 522 | 566 |
| 2018 | 430 | 374 | 348 | 396 | 466 | 547 | 490 | 477 | 530 | 455 | 440 | 374 |
| 2019 | 298 | 234 | 337 | 489 | 461 | 608 | 568 | 542 | 543 | 246 | 344 | 478 |
| 2020 | 348 | 380 | 360 | 318 | 370 | 510 | 499 | 587 | 533 | 541 | 644 | 560 |
| 2021 | 459 | 306 | 308 | 466 | 541 | 588 | 571 | 589 | 579 | 379 | 386 | 456 |
| 2022 | 409 | 310 | 316 | 363 | 441 | 504 | 477 | 495 | 485 | 615 | 581 | 484 |
| 2023 | 454 | 426 | 444 | 466 | 591 | 582 | 652 | 577 | 539 | 584 | 527 | 503 |
| 2024 | 359 | |||||||||||
| - = No Data Reported; -- = Not Applicable; NA = Not Available; W = Withheld to avoid disclosure of individual company data. |
| Release Date: 3/29/2024 |
| Next Release Date: 4/30/2024 |
Referring Pages: