|
Download Data (XLS File) |
|
||||||||
|
||||||||
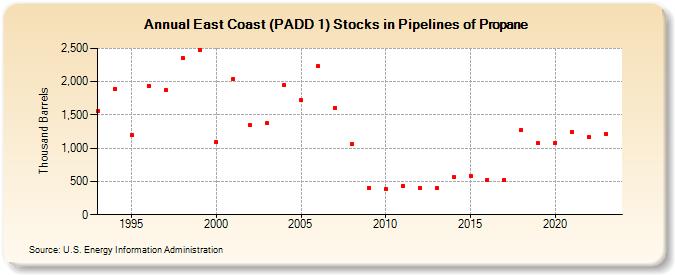
| East Coast (PADD 1) Stocks in Pipelines of Propane (Thousand Barrels) | ||||||||
| Decade | Year-0 | Year-1 | Year-2 | Year-3 | Year-4 | Year-5 | Year-6 | Year-7 | Year-8 | Year-9 |
|---|---|---|---|---|---|---|---|---|---|---|
| 1990's | 1,562 | 1,894 | 1,200 | 1,941 | 1,881 | 2,353 | 2,481 | |||
| 2000's | 1,095 | 2,041 | 1,341 | 1,375 | 1,952 | 1,719 | 2,231 | 1,605 | 1,061 | 408 |
| 2010's | 391 | 435 | 406 | 401 | 566 | 588 | 528 | 522 | 1,273 | 1,075 |
| 2020's | 1,083 | 1,249 | 1,164 | 1,217 |
| - = No Data Reported; -- = Not Applicable; NA = Not Available; W = Withheld to avoid disclosure of individual company data. |
| Release Date: 3/29/2024 |
| Next Release Date: 8/30/2024 |