|
Download Data (XLS File) |
|
||||||||
|
||||||||
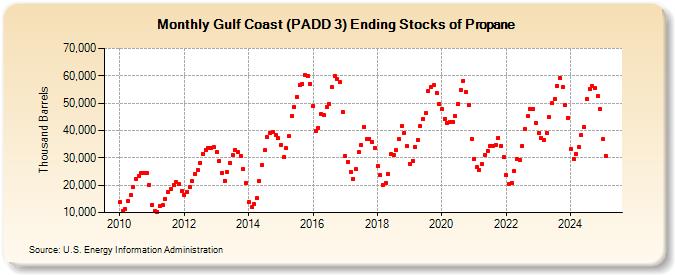
| Gulf Coast (PADD 3) Ending Stocks of Propane (Thousand Barrels) | ||||||||
| Year | Jan | Feb | Mar | Apr | May | Jun | Jul | Aug | Sep | Oct | Nov | Dec |
|---|---|---|---|---|---|---|---|---|---|---|---|---|
| 2010 | 13,733 | 10,514 | 11,288 | 14,183 | 16,311 | 19,212 | 22,355 | 23,320 | 24,416 | 24,522 | 24,393 | 20,102 |
| 2011 | 12,918 | 10,412 | 10,349 | 12,363 | 12,629 | 15,108 | 17,464 | 18,767 | 20,044 | 21,066 | 20,342 | 17,908 |
| 2012 | 16,476 | 17,523 | 19,309 | 21,565 | 24,234 | 25,691 | 28,262 | 31,457 | 33,024 | 33,417 | 33,731 | 33,883 |
| 2013 | 32,070 | 28,883 | 24,531 | 21,679 | 24,678 | 28,262 | 30,978 | 32,966 | 32,122 | 30,685 | 25,786 | 20,826 |
| 2014 | 13,731 | 12,011 | 13,098 | 15,207 | 21,446 | 27,343 | 32,756 | 37,494 | 39,157 | 39,370 | 38,529 | 37,076 |
| 2015 | 34,851 | 30,129 | 33,525 | 37,980 | 45,200 | 48,492 | 52,414 | 56,492 | 57,097 | 60,326 | 59,845 | 57,144 |
| 2016 | 48,809 | 39,938 | 41,050 | 45,986 | 45,555 | 48,659 | 49,696 | 55,774 | 59,825 | 58,772 | 57,620 | 46,781 |
| 2017 | 30,679 | 28,448 | 24,873 | 22,430 | 25,809 | 32,168 | 34,685 | 41,404 | 36,847 | 36,891 | 35,612 | 33,528 |
| 2018 | 27,051 | 23,562 | 20,249 | 20,861 | 24,037 | 31,268 | 30,963 | 32,696 | 36,737 | 41,644 | 39,179 | 34,260 |
| 2019 | 27,904 | 28,900 | 34,141 | 36,590 | 41,694 | 44,366 | 46,429 | 54,396 | 56,046 | 56,526 | 53,845 | 49,700 |
| 2020 | 47,742 | 44,120 | 42,604 | 43,133 | 42,974 | 45,275 | 49,697 | 54,798 | 58,215 | 54,116 | 49,251 | 36,926 |
| 2021 | 29,740 | 26,482 | 25,728 | 27,776 | 31,026 | 32,664 | 34,445 | 34,454 | 34,785 | 37,429 | 34,500 | 30,378 |
| 2022 | 23,613 | 20,617 | 20,905 | 25,269 | 29,580 | 29,209 | 34,426 | 40,378 | 45,163 | 47,730 | 48,024 | 42,813 |
| 2023 | 39,104 | 37,476 | 36,654 | 39,219 | 44,938 | 49,992 | 51,581 | 56,264 | 59,886 | 55,855 | 49,191 | 44,797 |
| 2024 | 33,178 | |||||||||||
| - = No Data Reported; -- = Not Applicable; NA = Not Available; W = Withheld to avoid disclosure of individual company data. |
| Release Date: 3/29/2024 |
| Next Release Date: 4/30/2024 |