|
Download Data (XLS File) |
|
||||||||
|
||||||||
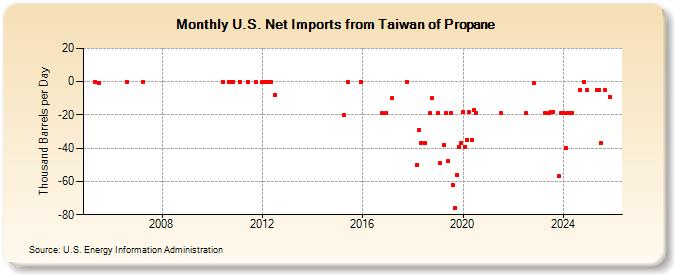
| U.S. Net Imports from Taiwan of Propane (Thousand Barrels per Day) | ||||||||
| Year | Jan | Feb | Mar | Apr | May | Jun | Jul | Aug | Sep | Oct | Nov | Dec |
|---|---|---|---|---|---|---|---|---|---|---|---|---|
| 2005 | 0 | -1 | ||||||||||
| 2006 | 0 | |||||||||||
| 2007 | 0 | |||||||||||
| 2010 | 0 | 0 | 0 | 0 | ||||||||
| 2011 | 0 | 0 | 0 | |||||||||
| 2012 | 0 | 0 | 0 | 0 | 0 | -8 | ||||||
| 2015 | -20 | 0 | 0 | |||||||||
| 2016 | -19 | -19 | ||||||||||
| 2017 | -10 | 0 | ||||||||||
| 2018 | -50 | -29 | -37 | -37 | -19 | -10 | ||||||
| 2019 | -19 | -49 | -38 | -19 | -48 | -19 | -62 | -76 | -56 | -39 | -37 | |
| 2020 | -18 | -39 | -35 | -18 | -35 | -17 | -19 | |||||
| 2021 | -19 | |||||||||||
| 2022 | -19 | -1 | ||||||||||
| 2023 | -19 | -19 | -18 | -18 | -57 | -19 | ||||||
| 2024 | -19 | -40 | -19 | -19 | ||||||||
| - = No Data Reported; -- = Not Applicable; NA = Not Available; W = Withheld to avoid disclosure of individual company data. |
| Release Date: 6/28/2024 |
| Next Release Date: 7/31/2024 |