|
Download Data (XLS File) |
|
||||||||
|
||||||||
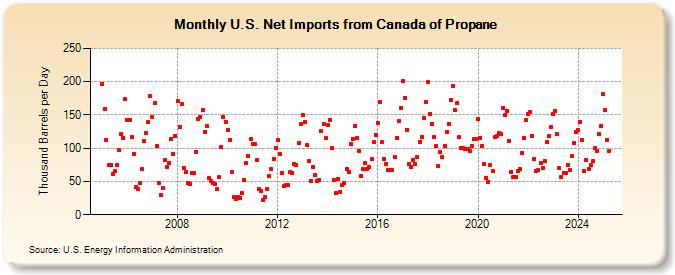
| U.S. Net Imports from Canada of Propane (Thousand Barrels per Day) | ||||||||
| Year | Jan | Feb | Mar | Apr | May | Jun | Jul | Aug | Sep | Oct | Nov | Dec |
|---|---|---|---|---|---|---|---|---|---|---|---|---|
| 2005 | 197 | 159 | 112 | 74 | 74 | 61 | 65 | 75 | 97 | 122 | 115 | 174 |
| 2006 | 143 | 143 | 117 | 92 | 41 | 39 | 48 | 69 | 111 | 123 | 140 | 178 |
| 2007 | 147 | 168 | 103 | 48 | 30 | 40 | 82 | 72 | 77 | 114 | 91 | 119 |
| 2008 | 171 | 132 | 166 | 70 | 64 | 48 | 46 | 62 | 63 | 95 | 144 | 147 |
| 2009 | 157 | 125 | 133 | 55 | 51 | 47 | 46 | 38 | 56 | 102 | 147 | 140 |
| 2010 | 127 | 112 | 64 | 26 | 23 | 27 | 25 | 33 | 52 | 78 | 88 | 114 |
| 2011 | 107 | 106 | 82 | 38 | 36 | 22 | 27 | 38 | 58 | 68 | 84 | 100 |
| 2012 | 113 | 91 | 63 | 43 | 44 | 44 | 64 | 63 | 76 | 75 | 108 | 137 |
| 2013 | 150 | 139 | 105 | 81 | 51 | 72 | 59 | 50 | 52 | 126 | 137 | 115 |
| 2014 | 135 | 142 | 100 | 52 | 32 | 53 | 34 | 44 | 47 | 69 | 64 | 106 |
| 2015 | 114 | 134 | 116 | 96 | 58 | 68 | 77 | 69 | 71 | 83 | 109 | 120 |
| 2016 | 138 | 169 | 109 | 83 | 76 | 67 | 67 | 67 | 87 | 116 | 141 | 160 |
| 2017 | 201 | 176 | 128 | 76 | 72 | 82 | 76 | 86 | 110 | 117 | 146 | 170 |
| 2018 | 199 | 152 | 137 | 117 | 103 | 73 | 95 | 86 | 103 | 124 | 137 | 172 |
| 2019 | 194 | 157 | 168 | 117 | 100 | 100 | 99 | 99 | 96 | 104 | 114 | 114 |
| 2020 | 144 | 116 | 103 | 76 | 55 | 49 | 74 | 66 | 117 | 118 | 123 | 121 |
| 2021 | 160 | 150 | 156 | 111 | 64 | 57 | 57 | 65 | 68 | 93 | 116 | 142 |
| 2022 | 152 | 154 | 119 | 84 | 66 | 67 | 78 | 70 | 81 | 110 | 118 | 132 |
| 2023 | 149 | 157 | 121 | 67 | 57 | 63 | 61 | 75 | 67 | 89 | 108 | 124 |
| 2024 | 127 | 140 | 113 | 65 | ||||||||
| - = No Data Reported; -- = Not Applicable; NA = Not Available; W = Withheld to avoid disclosure of individual company data. |
| Release Date: 6/28/2024 |
| Next Release Date: 7/31/2024 |