|
Download Data (XLS File) |
|
||||||||
|
||||||||
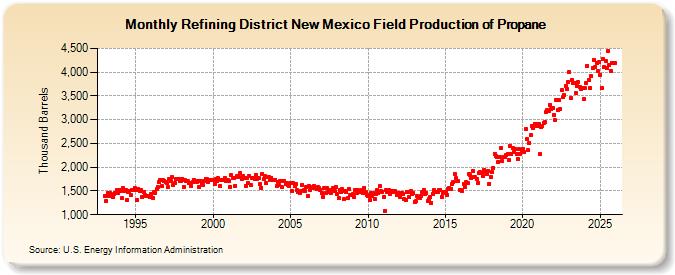
| Refining District New Mexico Field Production of Propane (Thousand Barrels) | ||||||||
| Year | Jan | Feb | Mar | Apr | May | Jun | Jul | Aug | Sep | Oct | Nov | Dec |
|---|---|---|---|---|---|---|---|---|---|---|---|---|
| 1993 | 1,401 | 1,279 | 1,456 | 1,390 | 1,453 | 1,397 | 1,376 | 1,443 | 1,447 | 1,521 | 1,454 | 1,530 |
| 1994 | 1,503 | 1,351 | 1,552 | 1,507 | 1,527 | 1,315 | 1,476 | 1,504 | 1,416 | 1,518 | 1,513 | 1,569 |
| 1995 | 1,525 | 1,305 | 1,551 | 1,498 | 1,518 | 1,378 | 1,478 | 1,419 | 1,386 | 1,396 | 1,402 | 1,366 |
| 1996 | 1,430 | 1,353 | 1,478 | 1,464 | 1,533 | 1,579 | 1,682 | 1,724 | 1,599 | 1,722 | 1,715 | 1,686 |
| 1997 | 1,671 | 1,581 | 1,757 | 1,718 | 1,789 | 1,631 | 1,657 | 1,751 | 1,749 | 1,758 | 1,713 | 1,706 |
| 1998 | 1,762 | 1,593 | 1,731 | 1,709 | 1,705 | 1,674 | 1,662 | 1,612 | 1,687 | 1,741 | 1,700 | 1,697 |
| 1999 | 1,719 | 1,587 | 1,717 | 1,645 | 1,629 | 1,706 | 1,757 | 1,745 | 1,698 | 1,738 | 1,726 | 1,723 |
| 2000 | 1,733 | 1,645 | 1,762 | 1,711 | 1,767 | 1,600 | 1,734 | 1,726 | 1,728 | 1,782 | 1,709 | 1,724 |
| 2001 | 1,712 | 1,591 | 1,830 | 1,774 | 1,768 | 1,610 | 1,806 | 1,788 | 1,785 | 1,879 | 1,757 | 1,811 |
| 2002 | 1,766 | 1,609 | 1,783 | 1,662 | 1,812 | 1,631 | 1,779 | 1,768 | 1,762 | 1,843 | 1,748 | 1,783 |
| 2003 | 1,650 | 1,572 | 1,859 | 1,746 | 1,810 | 1,657 | 1,788 | 1,795 | 1,729 | 1,781 | 1,728 | 1,734 |
| 2004 | 1,736 | 1,602 | 1,695 | 1,625 | 1,700 | 1,574 | 1,702 | 1,705 | 1,641 | 1,671 | 1,618 | 1,606 |
| 2005 | 1,676 | 1,507 | 1,660 | 1,605 | 1,643 | 1,519 | 1,485 | 1,452 | 1,502 | 1,631 | 1,512 | 1,494 |
| 2006 | 1,582 | 1,398 | 1,603 | 1,529 | 1,560 | 1,582 | 1,614 | 1,571 | 1,546 | 1,574 | 1,558 | 1,523 |
| 2007 | 1,452 | 1,372 | 1,553 | 1,455 | 1,555 | 1,483 | 1,530 | 1,466 | 1,490 | 1,552 | 1,503 | 1,590 |
| 2008 | 1,440 | 1,346 | 1,523 | 1,469 | 1,539 | 1,324 | 1,503 | 1,476 | 1,354 | 1,542 | 1,411 | 1,417 |
| 2009 | 1,426 | 1,365 | 1,527 | 1,464 | 1,523 | 1,500 | 1,488 | 1,521 | 1,447 | 1,564 | 1,486 | 1,412 |
| 2010 | 1,394 | 1,309 | 1,455 | 1,397 | 1,457 | 1,326 | 1,438 | 1,522 | 1,462 | 1,595 | 1,490 | 1,487 |
| 2011 | 1,375 | 1,085 | 1,515 | 1,480 | 1,516 | 1,430 | 1,509 | 1,507 | 1,468 | 1,491 | 1,421 | 1,464 |
| 2012 | 1,462 | 1,363 | 1,465 | 1,438 | 1,334 | 1,304 | 1,472 | 1,472 | 1,372 | 1,498 | 1,441 | 1,450 |
| 2013 | 1,275 | 1,287 | 1,387 | 1,382 | 1,355 | 1,402 | 1,487 | 1,523 | 1,436 | 1,464 | 1,290 | 1,329 |
| 2014 | 1,382 | 1,254 | 1,446 | 1,524 | 1,470 | 1,486 | 1,471 | 1,519 | 1,510 | 1,380 | 1,459 | 1,483 |
| 2015 | 1,479 | 1,423 | 1,544 | 1,565 | 1,551 | 1,651 | 1,681 | 1,855 | 1,764 | 1,710 | 1,708 | 1,521 |
| 2016 | 1,515 | 1,505 | 1,651 | 1,579 | 1,679 | 1,657 | 1,861 | 1,826 | 1,764 | 1,922 | 1,797 | 1,791 |
| 2017 | 1,758 | 1,675 | 1,888 | 1,893 | 1,878 | 1,818 | 1,938 | 1,906 | 1,849 | 1,930 | 1,653 | 1,789 |
| 2018 | 1,897 | 1,983 | 2,284 | 2,234 | 2,208 | 2,118 | 2,216 | 2,402 | 2,127 | 2,214 | 2,204 | 2,256 |
| 2019 | 2,278 | 2,154 | 2,448 | 2,276 | 2,412 | 2,323 | 2,385 | 2,276 | 2,163 | 2,376 | 2,287 | 2,354 |
| 2020 | 2,392 | 2,313 | 2,802 | 2,592 | 2,354 | 2,505 | 2,672 | 2,874 | 2,832 | 2,915 | 2,912 | 2,859 |
| 2021 | 2,905 | 2,268 | 2,844 | 2,870 | 2,937 | 2,945 | 3,158 | 3,206 | 3,184 | 3,317 | 3,218 | 3,241 |
| 2022 | 3,100 | 2,984 | 3,424 | 3,198 | 3,409 | 3,229 | 3,616 | 3,472 | 3,514 | 3,713 | 3,646 | 3,794 |
| 2023 | 4,101 | 3,578 | 3,957 | 3,888 | 3,799 | 3,593 | 3,706 | 3,774 | 3,726 | 3,675 | 3,659 | 3,395 |
| 2024 | 3,587 | |||||||||||
| - = No Data Reported; -- = Not Applicable; NA = Not Available; W = Withheld to avoid disclosure of individual company data. |
| Release Date: 3/29/2024 |
| Next Release Date: 4/30/2024 |