|
Download Data (XLS File) |
|
||||||||
|
||||||||
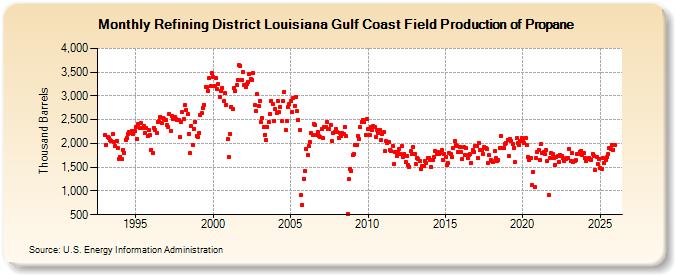
| Refining District Louisiana Gulf Coast Field Production of Propane (Thousand Barrels) | ||||||||
| Year | Jan | Feb | Mar | Apr | May | Jun | Jul | Aug | Sep | Oct | Nov | Dec |
|---|---|---|---|---|---|---|---|---|---|---|---|---|
| 1993 | 2,183 | 1,964 | 2,143 | 2,105 | 2,069 | 2,060 | 2,199 | 2,039 | 1,942 | 2,059 | 1,894 | 1,665 |
| 1994 | 1,722 | 1,662 | 1,868 | 1,809 | 2,078 | 2,112 | 2,203 | 2,238 | 2,224 | 2,253 | 2,208 | 2,252 |
| 1995 | 2,336 | 2,100 | 2,402 | 2,328 | 2,420 | 2,321 | 2,361 | 2,222 | 2,321 | 2,148 | 2,283 | 2,176 |
| 1996 | 1,870 | 1,792 | 2,335 | 2,278 | 2,229 | 2,455 | 2,463 | 2,553 | 2,431 | 2,531 | 2,516 | 2,498 |
| 1997 | 2,390 | 2,336 | 2,621 | 2,267 | 2,587 | 2,523 | 2,559 | 2,509 | 2,491 | 2,488 | 2,131 | 2,459 |
| 1998 | 2,658 | 2,513 | 2,804 | 2,695 | 2,613 | 2,206 | 1,789 | 2,370 | 1,966 | 2,311 | 2,450 | 2,155 |
| 1999 | 2,140 | 2,229 | 2,598 | 2,631 | 2,751 | 2,817 | 3,196 | 3,182 | 3,111 | 3,367 | 3,213 | 3,472 |
| 2000 | 3,392 | 3,203 | 3,375 | 3,138 | 3,254 | 2,983 | 3,100 | 3,167 | 2,884 | 3,054 | 2,817 | 2,092 |
| 2001 | 1,706 | 2,204 | 2,767 | 2,719 | 3,157 | 3,099 | 3,231 | 3,344 | 3,645 | 3,635 | 3,332 | 3,508 |
| 2002 | 3,221 | 3,198 | 3,249 | 3,302 | 3,457 | 3,348 | 3,342 | 3,479 | 2,807 | 2,677 | 3,039 | 2,789 |
| 2003 | 2,893 | 2,445 | 2,531 | 2,337 | 2,185 | 2,073 | 2,350 | 2,456 | 2,629 | 2,902 | 2,820 | 2,474 |
| 2004 | 2,717 | 2,649 | 2,897 | 2,655 | 2,768 | 2,462 | 2,895 | 3,085 | 2,287 | 2,477 | 2,774 | 2,826 |
| 2005 | 2,889 | 2,664 | 2,961 | 2,792 | 2,982 | 2,679 | 2,498 | 2,279 | 917 | 706 | 1,261 | 1,412 |
| 2006 | 1,883 | 1,760 | 1,943 | 2,038 | 2,218 | 2,185 | 2,405 | 2,378 | 2,185 | 2,237 | 2,146 | 2,138 |
| 2007 | 2,302 | 2,107 | 2,341 | 2,351 | 2,447 | 2,295 | 2,310 | 2,392 | 2,054 | 2,215 | 2,248 | 2,309 |
| 2008 | 2,238 | 2,123 | 2,227 | 2,160 | 2,221 | 2,204 | 2,355 | 2,152 | 509 | 1,242 | 1,458 | 1,417 |
| 2009 | 1,753 | 1,788 | 1,968 | 1,971 | 2,158 | 2,091 | 2,339 | 2,455 | 2,498 | 2,446 | 2,182 | 2,506 |
| 2010 | 2,304 | 2,174 | 2,350 | 2,288 | 2,368 | 2,348 | 2,140 | 2,291 | 2,212 | 2,291 | 2,082 | 2,195 |
| 2011 | 2,237 | 1,835 | 2,043 | 2,006 | 2,028 | 1,867 | 1,835 | 1,951 | 1,564 | 1,826 | 1,743 | 1,824 |
| 2012 | 1,887 | 1,779 | 1,943 | 1,709 | 1,786 | 1,614 | 1,739 | 1,546 | 1,500 | 1,831 | 1,780 | 1,917 |
| 2013 | 1,783 | 1,565 | 1,702 | 1,669 | 1,621 | 1,465 | 1,524 | 1,520 | 1,635 | 1,583 | 1,685 | 1,700 |
| 2014 | 1,643 | 1,500 | 1,650 | 1,716 | 1,835 | 1,777 | 1,821 | 1,786 | 1,798 | 1,861 | 1,659 | 1,778 |
| 2015 | 1,723 | 1,545 | 1,588 | 1,793 | 1,770 | 1,711 | 1,903 | 2,042 | 1,957 | 1,956 | 1,824 | 1,927 |
| 2016 | 1,830 | 1,675 | 1,920 | 1,756 | 1,898 | 1,684 | 1,764 | 1,773 | 1,593 | 1,865 | 1,820 | 1,938 |
| 2017 | 1,942 | 1,688 | 2,006 | 1,860 | 1,869 | 1,780 | 1,931 | 1,901 | 1,874 | 1,586 | 1,754 | 1,656 |
| 2018 | 1,639 | 1,600 | 1,834 | 1,685 | 1,621 | 1,648 | 1,901 | 2,160 | 1,911 | 1,906 | 1,978 | 2,013 |
| 2019 | 2,075 | 1,736 | 2,093 | 2,049 | 1,988 | 1,911 | 1,599 | 2,109 | 2,006 | 1,963 | 2,049 | 2,121 |
| 2020 | 2,082 | 2,001 | 2,120 | 1,973 | 1,713 | 1,646 | 1,695 | 1,124 | 1,400 | 1,082 | 1,693 | 1,824 |
| 2021 | 1,865 | 1,656 | 1,983 | 1,803 | 1,816 | 1,768 | 1,868 | 1,631 | 925 | 1,696 | 1,793 | 1,779 |
| 2022 | 1,703 | 1,549 | 1,717 | 1,735 | 1,615 | 1,758 | 1,741 | 1,688 | 1,627 | 1,682 | 1,701 | 1,685 |
| 2023 | 1,893 | 1,637 | 1,806 | 1,619 | 1,639 | 3,379 | 1,785 | 1,781 | 1,827 | 1,848 | 1,760 | 1,797 |
| 2024 | 1,719 | |||||||||||
| - = No Data Reported; -- = Not Applicable; NA = Not Available; W = Withheld to avoid disclosure of individual company data. |
| Release Date: 3/29/2024 |
| Next Release Date: 4/30/2024 |