|
Download Data (XLS File) |
|
||||||||
|
||||||||
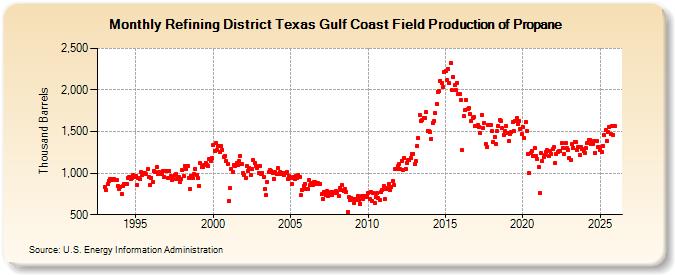
| Refining District Texas Gulf Coast Field Production of Propane (Thousand Barrels) | ||||||||
| Year | Jan | Feb | Mar | Apr | May | Jun | Jul | Aug | Sep | Oct | Nov | Dec |
|---|---|---|---|---|---|---|---|---|---|---|---|---|
| 1993 | 837 | 793 | 869 | 907 | 930 | 912 | 927 | 928 | 922 | 923 | 850 | 814 |
| 1994 | 839 | 753 | 840 | 872 | 871 | 874 | 940 | 959 | 925 | 938 | 973 | 953 |
| 1995 | 970 | 859 | 945 | 927 | 1,013 | 977 | 1,006 | 1,007 | 989 | 1,049 | 954 | 853 |
| 1996 | 946 | 892 | 1,028 | 1,012 | 1,068 | 988 | 1,014 | 1,005 | 989 | 1,030 | 958 | 1,020 |
| 1997 | 1,028 | 941 | 1,030 | 962 | 920 | 926 | 974 | 985 | 935 | 953 | 891 | 935 |
| 1998 | 1,036 | 961 | 1,090 | 1,048 | 1,081 | 943 | 811 | 961 | 937 | 985 | 1,054 | 976 |
| 1999 | 937 | 850 | 1,116 | 1,074 | 1,068 | 1,095 | 1,125 | 1,102 | 1,088 | 1,168 | 1,147 | 1,176 |
| 2000 | 1,339 | 1,264 | 1,358 | 1,279 | 1,330 | 1,250 | 1,325 | 1,284 | 1,197 | 1,208 | 1,143 | 1,109 |
| 2001 | 659 | 817 | 1,055 | 1,008 | 1,098 | 1,082 | 1,124 | 1,099 | 1,145 | 1,207 | 1,104 | 998 |
| 2002 | 981 | 947 | 1,090 | 1,026 | 1,064 | 979 | 1,048 | 1,155 | 1,125 | 1,089 | 1,059 | 1,003 |
| 2003 | 1,086 | 991 | 1,004 | 948 | 809 | 734 | 895 | 1,010 | 1,033 | 1,031 | 996 | 933 |
| 2004 | 1,015 | 989 | 1,056 | 987 | 1,016 | 991 | 1,006 | 975 | 996 | 1,012 | 932 | 961 |
| 2005 | 941 | 870 | 955 | 933 | 971 | 943 | 982 | 953 | 737 | 801 | 847 | 874 |
| 2006 | 814 | 814 | 912 | 860 | 887 | 855 | 894 | 893 | 871 | 878 | 869 | 873 |
| 2007 | 745 | 686 | 778 | 734 | 780 | 724 | 758 | 770 | 739 | 774 | 764 | 780 |
| 2008 | 773 | 730 | 821 | 793 | 857 | 784 | 810 | 776 | 531 | 711 | 676 | 697 |
| 2009 | 692 | 645 | 694 | 682 | 724 | 675 | 629 | 722 | 692 | 728 | 718 | 731 |
| 2010 | 761 | 694 | 778 | 670 | 760 | 645 | 707 | 757 | 703 | 673 | 779 | 801 |
| 2011 | 849 | 683 | 808 | 823 | 874 | 796 | 832 | 902 | 855 | 1,045 | 1,048 | 1,081 |
| 2012 | 1,111 | 1,048 | 1,146 | 1,041 | 1,180 | 1,054 | 1,124 | 1,152 | 1,154 | 1,186 | 1,231 | 1,236 |
| 2013 | 1,108 | 1,140 | 1,328 | 1,422 | 1,694 | 1,623 | 1,640 | 1,666 | 1,665 | 1,732 | 1,510 | 1,505 |
| 2014 | 1,489 | 1,415 | 1,602 | 1,625 | 1,721 | 1,836 | 1,978 | 1,984 | 2,109 | 2,083 | 2,034 | 2,211 |
| 2015 | 2,225 | 2,114 | 2,258 | 2,080 | 2,326 | 1,995 | 2,158 | 2,056 | 1,999 | 2,088 | 1,955 | 1,947 |
| 2016 | 1,878 | 1,273 | 1,683 | 1,758 | 1,885 | 1,768 | 1,780 | 1,710 | 1,621 | 1,661 | 1,672 | 1,566 |
| 2017 | 1,567 | 1,584 | 1,558 | 1,478 | 1,703 | 1,548 | 1,607 | 1,354 | 1,319 | 1,579 | 1,582 | 1,577 |
| 2018 | 1,502 | 1,378 | 1,435 | 1,351 | 1,504 | 1,570 | 1,641 | 1,630 | 1,537 | 1,459 | 1,503 | 1,567 |
| 2019 | 1,481 | 1,382 | 1,473 | 1,493 | 1,614 | 1,511 | 1,625 | 1,661 | 1,585 | 1,626 | 1,535 | 1,467 |
| 2020 | 1,557 | 1,420 | 1,612 | 1,508 | 1,225 | 997 | 1,246 | 1,265 | 1,205 | 1,304 | 1,212 | 1,170 |
| 2021 | 1,076 | 767 | 1,239 | 1,140 | 1,189 | 1,213 | 1,260 | 1,273 | 1,208 | 1,264 | 1,235 | 1,288 |
| 2022 | 1,309 | 1,123 | 1,230 | 1,252 | 1,271 | 1,266 | 1,359 | 1,300 | 1,230 | 1,361 | 1,300 | 1,278 |
| 2023 | 1,182 | 1,159 | 1,346 | 1,320 | 1,378 | 1,373 | 1,279 | 1,318 | 1,239 | 1,315 | 1,290 | 1,261 |
| 2024 | 1,242 | |||||||||||
| - = No Data Reported; -- = Not Applicable; NA = Not Available; W = Withheld to avoid disclosure of individual company data. |
| Release Date: 3/29/2024 |
| Next Release Date: 4/30/2024 |