|
Download Data (XLS File) |
|
||||||||
|
||||||||
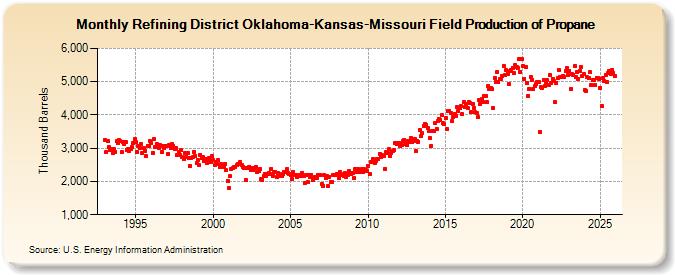
| Refining District Oklahoma-Kansas-Missouri Field Production of Propane (Thousand Barrels) | ||||||||
| Year | Jan | Feb | Mar | Apr | May | Jun | Jul | Aug | Sep | Oct | Nov | Dec |
|---|---|---|---|---|---|---|---|---|---|---|---|---|
| 1993 | 3,247 | 2,885 | 3,204 | 3,042 | 2,960 | 2,966 | 2,848 | 2,967 | 2,898 | 3,208 | 3,142 | 3,233 |
| 1994 | 3,217 | 2,873 | 3,193 | 3,116 | 3,178 | 2,949 | 2,983 | 2,927 | 2,978 | 3,021 | 3,144 | 3,269 |
| 1995 | 3,199 | 2,884 | 3,072 | 3,000 | 3,121 | 2,868 | 3,001 | 2,928 | 2,763 | 3,075 | 3,063 | 3,213 |
| 1996 | 3,163 | 2,863 | 3,267 | 3,037 | 3,119 | 3,045 | 3,016 | 3,083 | 2,885 | 3,061 | 3,006 | 3,065 |
| 1997 | 3,069 | 2,840 | 3,087 | 3,002 | 3,114 | 3,078 | 2,983 | 3,008 | 2,793 | 2,887 | 2,784 | 2,933 |
| 1998 | 2,731 | 2,679 | 2,856 | 2,748 | 2,851 | 2,698 | 2,472 | 2,716 | 2,725 | 2,897 | 2,764 | 2,552 |
| 1999 | 2,652 | 2,485 | 2,802 | 2,694 | 2,722 | 2,611 | 2,677 | 2,541 | 2,644 | 2,711 | 2,579 | 2,753 |
| 2000 | 2,646 | 2,486 | 2,570 | 2,528 | 2,634 | 2,449 | 2,516 | 2,457 | 2,445 | 2,526 | 2,331 | 2,014 |
| 2001 | 1,818 | 2,153 | 2,388 | 2,408 | 2,426 | 2,444 | 2,492 | 2,518 | 2,523 | 2,584 | 2,482 | 2,436 |
| 2002 | 2,394 | 2,051 | 2,405 | 2,402 | 2,448 | 2,351 | 2,397 | 2,358 | 2,402 | 2,446 | 2,295 | 2,328 |
| 2003 | 2,388 | 2,078 | 2,058 | 2,149 | 2,228 | 2,158 | 2,215 | 2,261 | 2,238 | 2,379 | 2,178 | 2,287 |
| 2004 | 2,285 | 2,121 | 2,260 | 2,238 | 2,170 | 2,156 | 2,219 | 2,277 | 2,273 | 2,365 | 2,253 | 2,217 |
| 2005 | 2,180 | 2,062 | 2,276 | 2,179 | 2,204 | 2,131 | 2,160 | 2,187 | 2,150 | 2,262 | 2,150 | 1,939 |
| 2006 | 2,179 | 1,980 | 2,199 | 2,132 | 2,204 | 2,035 | 2,106 | 2,129 | 2,111 | 2,181 | 2,200 | 2,187 |
| 2007 | 1,928 | 1,877 | 2,190 | 2,111 | 2,161 | 1,861 | 2,144 | 1,978 | 1,992 | 2,198 | 2,193 | 2,208 |
| 2008 | 2,227 | 2,107 | 2,279 | 2,209 | 2,207 | 2,177 | 2,257 | 2,131 | 2,194 | 2,304 | 2,262 | 2,217 |
| 2009 | 2,245 | 2,114 | 2,374 | 2,286 | 2,389 | 2,308 | 2,297 | 2,368 | 2,298 | 2,366 | 2,340 | 2,314 |
| 2010 | 2,470 | 2,216 | 2,583 | 2,588 | 2,680 | 2,561 | 2,624 | 2,678 | 2,676 | 2,834 | 2,727 | 2,785 |
| 2011 | 2,780 | 2,387 | 2,886 | 2,867 | 2,966 | 2,778 | 2,849 | 2,907 | 2,954 | 3,142 | 3,111 | 3,161 |
| 2012 | 3,158 | 3,057 | 3,089 | 3,217 | 3,255 | 3,122 | 3,088 | 3,217 | 3,199 | 3,320 | 3,181 | 3,206 |
| 2013 | 3,280 | 2,907 | 3,219 | 3,200 | 3,553 | 3,357 | 3,445 | 3,673 | 3,742 | 3,704 | 3,617 | 3,520 |
| 2014 | 3,306 | 3,069 | 3,527 | 3,512 | 3,751 | 3,587 | 3,816 | 3,888 | 3,853 | 3,985 | 3,747 | 3,724 |
| 2015 | 3,902 | 3,562 | 4,103 | 4,124 | 4,052 | 3,807 | 3,945 | 4,029 | 3,963 | 4,232 | 4,115 | 4,193 |
| 2016 | 4,255 | 4,013 | 4,377 | 4,236 | 4,319 | 4,209 | 4,381 | 4,350 | 4,087 | 4,323 | 4,209 | 4,086 |
| 2017 | 4,069 | 3,929 | 4,434 | 4,314 | 4,470 | 4,383 | 4,583 | 4,563 | 4,388 | 4,860 | 4,790 | 4,809 |
| 2018 | 4,766 | 4,206 | 5,115 | 4,990 | 5,287 | 4,980 | 5,066 | 5,087 | 5,178 | 5,468 | 5,200 | 5,336 |
| 2019 | 5,242 | 4,923 | 5,320 | 5,349 | 5,425 | 5,260 | 5,509 | 5,428 | 5,425 | 5,675 | 5,300 | 5,667 |
| 2020 | 5,485 | 5,094 | 5,448 | 4,955 | 4,578 | 4,788 | 5,151 | 5,055 | 4,786 | 4,857 | 4,926 | 4,992 |
| 2021 | 5,000 | 3,486 | 4,828 | 4,820 | 5,047 | 4,856 | 4,955 | 5,036 | 4,902 | 5,196 | 4,963 | 5,089 |
| 2022 | 5,023 | 4,375 | 4,966 | 5,117 | 5,349 | 5,127 | 5,150 | 5,178 | 5,133 | 5,327 | 5,401 | 5,196 |
| 2023 | 5,219 | 4,655 | 5,105 | 5,113 | 5,594 | 5,231 | 5,401 | 5,162 | 5,414 | 5,542 | 5,261 | 5,229 |
| 2024 | 4,729 | |||||||||||
| - = No Data Reported; -- = Not Applicable; NA = Not Available; W = Withheld to avoid disclosure of individual company data. |
| Release Date: 3/29/2024 |
| Next Release Date: 4/30/2024 |