|
Download Data (XLS File) |
|
||||||||
|
||||||||
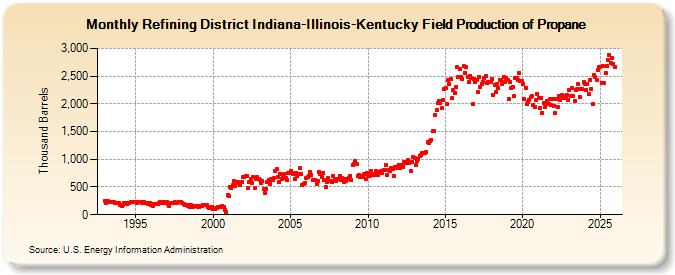
| Refining District Indiana-Illinois-Kentucky Field Production of Propane (Thousand Barrels) | ||||||||
| Year | Jan | Feb | Mar | Apr | May | Jun | Jul | Aug | Sep | Oct | Nov | Dec |
|---|---|---|---|---|---|---|---|---|---|---|---|---|
| 1993 | 252 | 216 | 239 | 233 | 231 | 228 | 223 | 227 | 209 | 210 | 208 | 210 |
| 1994 | 178 | 160 | 172 | 215 | 210 | 193 | 217 | 214 | 221 | 229 | 224 | 224 |
| 1995 | 227 | 219 | 235 | 231 | 232 | 209 | 225 | 220 | 203 | 187 | 203 | 213 |
| 1996 | 172 | 163 | 199 | 202 | 197 | 195 | 212 | 222 | 211 | 228 | 219 | 225 |
| 1997 | 223 | 187 | 155 | 205 | 217 | 217 | 222 | 215 | 212 | 222 | 223 | 229 |
| 1998 | 218 | 201 | 177 | 168 | 157 | 175 | 148 | 169 | 146 | 152 | 166 | 165 |
| 1999 | 137 | 145 | 162 | 157 | 183 | 174 | 182 | 177 | 148 | 115 | 130 | 147 |
| 2000 | 104 | 98 | 119 | 122 | 137 | 137 | 147 | 156 | 141 | 81 | 53 | 350 |
| 2001 | 329 | 500 | 479 | 533 | 606 | 522 | 586 | 599 | 565 | 528 | 589 | 687 |
| 2002 | 672 | 691 | 692 | 483 | 595 | 642 | 576 | 676 | 474 | 652 | 672 | 648 |
| 2003 | 629 | 578 | 615 | 466 | 390 | 461 | 598 | 629 | 562 | 641 | 628 | 657 |
| 2004 | 786 | 821 | 685 | 597 | 729 | 650 | 681 | 728 | 664 | 632 | 754 | 745 |
| 2005 | 790 | 744 | 727 | 644 | 757 | 704 | 731 | 835 | 740 | 535 | 562 | 574 |
| 2006 | 665 | 674 | 705 | 770 | 710 | 628 | 629 | 628 | 555 | 605 | 769 | 733 |
| 2007 | 682 | 745 | 628 | 500 | 594 | 660 | 610 | 616 | 595 | 693 | 618 | 601 |
| 2008 | 652 | 651 | 704 | 624 | 663 | 586 | 647 | 611 | 650 | 659 | 699 | 618 |
| 2009 | 893 | 912 | 968 | 909 | 704 | 712 | 688 | 694 | 680 | 731 | 647 | 752 |
| 2010 | 722 | 707 | 784 | 733 | 712 | 721 | 781 | 772 | 716 | 775 | 781 | 749 |
| 2011 | 810 | 805 | 899 | 713 | 810 | 789 | 840 | 817 | 707 | 852 | 851 | 872 |
| 2012 | 892 | 840 | 892 | 862 | 951 | 924 | 957 | 984 | 929 | 793 | 957 | 1,042 |
| 2013 | 1,017 | 901 | 965 | 1,010 | 1,059 | 1,077 | 1,112 | 1,109 | 1,105 | 1,137 | 1,308 | 1,297 |
| 2014 | 1,333 | 1,354 | 1,501 | 1,505 | 1,802 | 1,882 | 2,022 | 2,052 | 2,007 | 1,925 | 2,061 | 2,268 |
| 2015 | 2,284 | 2,000 | 2,421 | 2,355 | 2,451 | 2,097 | 2,246 | 2,187 | 2,302 | 2,663 | 2,487 | 2,622 |
| 2016 | 2,489 | 2,442 | 2,681 | 2,554 | 2,669 | 2,480 | 2,394 | 2,507 | 2,458 | 1,996 | 2,443 | 2,401 |
| 2017 | 2,438 | 2,221 | 2,491 | 2,302 | 2,365 | 2,400 | 2,464 | 2,495 | 2,380 | 2,399 | 2,387 | 2,391 |
| 2018 | 2,456 | 2,157 | 2,341 | 2,211 | 2,354 | 2,277 | 2,426 | 2,431 | 2,349 | 2,479 | 2,396 | 2,467 |
| 2019 | 2,423 | 2,080 | 2,397 | 2,288 | 2,312 | 2,133 | 2,460 | 2,473 | 2,432 | 2,552 | 2,419 | 2,418 |
| 2020 | 2,357 | 2,086 | 2,291 | 1,994 | 2,025 | 2,068 | 2,121 | 2,134 | 1,984 | 1,934 | 2,068 | 2,183 |
| 2021 | 2,112 | 1,921 | 2,110 | 1,841 | 2,010 | 1,935 | 1,988 | 2,056 | 2,002 | 2,080 | 1,975 | 2,094 |
| 2022 | 1,967 | 1,827 | 2,089 | 1,945 | 2,143 | 2,064 | 2,153 | 2,138 | 2,099 | 2,137 | 2,164 | 2,074 |
| 2023 | 2,246 | 2,141 | 2,285 | 2,144 | 2,050 | 2,251 | 2,271 | 2,352 | 2,123 | 2,265 | 2,275 | 2,385 |
| 2024 | 2,184 | |||||||||||
| - = No Data Reported; -- = Not Applicable; NA = Not Available; W = Withheld to avoid disclosure of individual company data. |
| Release Date: 3/29/2024 |
| Next Release Date: 4/30/2024 |