|
Download Data (XLS File) |
|
||||||||
|
||||||||
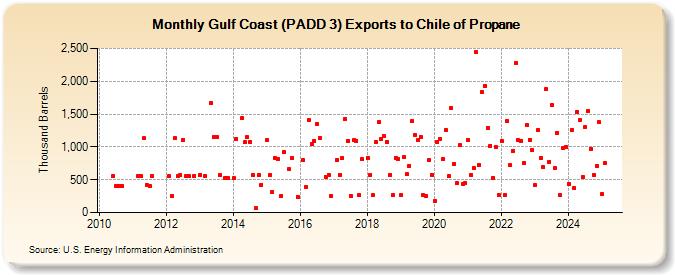
| Gulf Coast (PADD 3) Exports to Chile of Propane (Thousand Barrels) | ||||||||
| Year | Jan | Feb | Mar | Apr | May | Jun | Jul | Aug | Sep | Oct | Nov | Dec |
|---|---|---|---|---|---|---|---|---|---|---|---|---|
| 2010 | 556 | 410 | 410 | 410 | ||||||||
| 2011 | 550 | 550 | 1,128 | 422 | 410 | 550 | ||||||
| 2012 | 550 | 252 | 1,128 | 550 | 575 | 1,108 | 550 | 550 | 562 | |||
| 2013 | 575 | 560 | 1,675 | 1,150 | 1,146 | 575 | 525 | 525 | ||||
| 2014 | 525 | 1,127 | 1,435 | 1,068 | 1,144 | 1,082 | 577 | 63 | 573 | 421 | ||
| 2015 | 1,098 | 575 | 312 | 836 | 819 | 247 | 921 | 659 | 830 | 243 | ||
| 2016 | 796 | 395 | 1,412 | 1,037 | 1,091 | 1,350 | 1,136 | 549 | 577 | 249 | ||
| 2017 | 801 | 577 | 832 | 1,422 | 1,096 | 259 | 1,099 | 1,096 | 261 | 810 | ||
| 2018 | 833 | 577 | 260 | 1,073 | 1,373 | 1,121 | 1,161 | 1,078 | 577 | 261 | 838 | 812 |
| 2019 | 261 | 841 | 583 | 713 | 1,394 | 1,186 | 1,102 | 1,152 | 264 | 245 | 796 | 577 |
| 2020 | 178 | 1,069 | 1,126 | 811 | 1,260 | 551 | 1,592 | 747 | 449 | 1,023 | 440 | 445 |
| 2021 | 1,104 | 576 | 681 | 2,443 | 719 | 1,837 | 1,922 | 1,294 | 1,021 | 530 | 994 | 266 |
| 2022 | 1,097 | 267 | 1,393 | 719 | 945 | 2,279 | 1,107 | 1,092 | 758 | 1,326 | 1,109 | 947 |
| 2023 | 416 | 1,766 | 820 | 960 | 2,139 | 875 | 1,629 | 675 | 1,218 | 262 | 981 | 1,003 |
| 2024 | 441 | |||||||||||
| - = No Data Reported; -- = Not Applicable; NA = Not Available; W = Withheld to avoid disclosure of individual company data. |
| Release Date: 3/29/2024 |
| Next Release Date: 4/30/2024 |