|
Download Data (XLS File) |
|
||||||||
|
||||||||
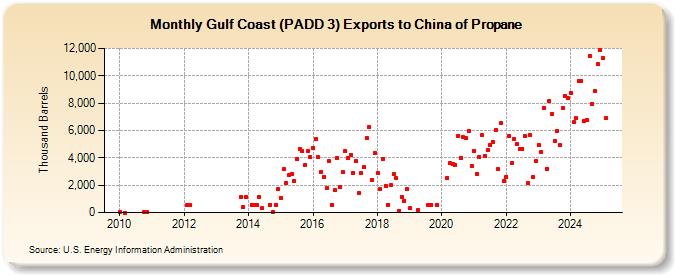
| Gulf Coast (PADD 3) Exports to China of Propane (Thousand Barrels) | ||||||||
| Year | Jan | Feb | Mar | Apr | May | Jun | Jul | Aug | Sep | Oct | Nov | Dec |
|---|---|---|---|---|---|---|---|---|---|---|---|---|
| 2010 | 35 | 0 | 17 | 25 | ||||||||
| 2012 | 550 | 550 | ||||||||||
| 2013 | 1,105 | 389 | 1,154 | |||||||||
| 2014 | 577 | 577 | 574 | 1,159 | 311 | 577 | 52 | 577 | 1,711 | |||
| 2015 | 1,090 | 3,165 | 2,167 | 2,727 | 2,814 | 2,321 | 3,916 | 4,612 | 4,465 | 3,489 | 4,494 | 4,027 |
| 2016 | 4,743 | 5,363 | 4,037 | 2,968 | 2,611 | 1,771 | 3,736 | 576 | 1,615 | 4,009 | 1,893 | 2,935 |
| 2017 | 4,487 | 3,954 | 4,225 | 2,887 | 3,753 | 1,450 | 2,868 | 3,301 | 5,438 | 6,246 | 2,384 | 4,366 |
| 2018 | 2,875 | 1,731 | 3,940 | 1,970 | 586 | 2,006 | 2,833 | 2,530 | 144 | 1,158 | 876 | 1,704 |
| 2019 | 299 | 152 | 575 | 569 | 578 | |||||||
| 2020 | 2,544 | 3,595 | 3,547 | 3,442 | 5,629 | 4,007 | 5,517 | 5,415 | 5,953 | 3,432 | ||
| 2021 | 4,518 | 2,848 | 4,042 | 5,645 | 4,127 | 4,541 | 4,930 | 5,183 | 6,004 | 3,150 | 6,540 | 2,294 |
| 2022 | 2,625 | 5,620 | 3,623 | 5,389 | 5,005 | 4,639 | 4,672 | 5,565 | 2,132 | 5,652 | 2,570 | 3,783 |
| 2023 | 4,904 | 4,430 | 7,637 | 3,220 | 8,124 | 7,233 | 5,256 | 5,970 | 4,947 | 7,646 | 8,522 | 8,339 |
| 2024 | 8,761 | 6,584 | 6,904 | 9,603 | 9,626 | 6,704 | ||||||
| - = No Data Reported; -- = Not Applicable; NA = Not Available; W = Withheld to avoid disclosure of individual company data. |
| Release Date: 8/30/2024 |
| Next Release Date: 9/30/2024 |