|
Download Data (XLS File) |
|
||||||||
|
||||||||
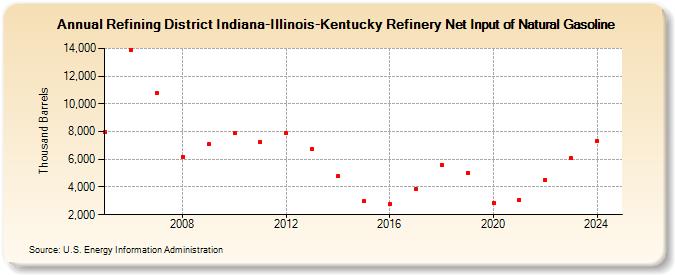
| Refining District Indiana-Illinois-Kentucky Refinery Net Input of Natural Gasoline (Thousand Barrels) | ||||||||
| Decade | Year-0 | Year-1 | Year-2 | Year-3 | Year-4 | Year-5 | Year-6 | Year-7 | Year-8 | Year-9 |
|---|---|---|---|---|---|---|---|---|---|---|
| 2000's | 7,952 | 13,909 | 10,782 | 6,200 | 7,079 | |||||
| 2010's | 7,872 | 7,269 | 7,891 | 6,737 | 4,789 | 2,956 | 2,745 | 3,864 | 5,596 | 5,039 |
| 2020's | 2,872 | 3,088 | 4,537 | 5,942 |
| - = No Data Reported; -- = Not Applicable; NA = Not Available; W = Withheld to avoid disclosure of individual company data. |
| Release Date: 3/29/2024 |
| Next Release Date: 8/30/2024 |