|
Download Data (XLS File) |
|
||||||||
|
||||||||
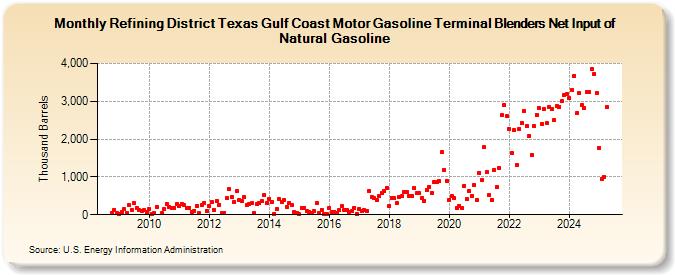
| Refining District Texas Gulf Coast Motor Gasoline Terminal Blenders Net Input of Natural Gasoline (Thousand Barrels) | ||||||||
| Year | Jan | Feb | Mar | Apr | May | Jun | Jul | Aug | Sep | Oct | Nov | Dec |
|---|---|---|---|---|---|---|---|---|---|---|---|---|
| 2008 | 50 | 128 | 53 | |||||||||
| 2009 | 28 | 69 | 149 | 41 | 246 | 134 | 302 | 179 | 112 | 106 | 116 | 65 |
| 2010 | 160 | 21 | 53 | 211 | 34 | 140 | 278 | 208 | 182 | 178 | 275 | |
| 2011 | 242 | 290 | 249 | 185 | 186 | 82 | 111 | 238 | 39 | 251 | 314 | 102 |
| 2012 | 224 | 330 | 125 | 367 | 263 | 34 | 57 | 446 | 671 | 468 | 339 | 631 |
| 2013 | 389 | 360 | 461 | 254 | 290 | 301 | 49 | 275 | 310 | 353 | 519 | 304 |
| 2014 | 423 | 327 | 24 | 147 | 415 | 326 | 391 | 213 | 298 | 263 | 67 | 52 |
| 2015 | 8 | 186 | 179 | 107 | 72 | 44 | 92 | 310 | 35 | 136 | 19 | 18 |
| 2016 | 183 | 66 | 79 | 58 | 120 | 222 | 130 | 127 | 80 | 92 | 190 | 28 |
| 2017 | 163 | 91 | 125 | 107 | 633 | 474 | 438 | 382 | 496 | 566 | 615 | 711 |
| 2018 | 237 | 454 | 435 | 308 | 474 | 483 | 590 | 598 | 506 | 504 | 700 | 576 |
| 2019 | 569 | 452 | 372 | 641 | 741 | 584 | 855 | 874 | 885 | 1,646 | 1,182 | 893 |
| 2020 | 400 | 484 | 430 | 178 | 234 | 178 | 767 | 406 | 633 | 505 | 791 | 384 |
| 2021 | 1,106 | 913 | 1,784 | 1,134 | 511 | 385 | 1,187 | 722 | 1,242 | 2,637 | 2,906 | 2,617 |
| 2022 | 2,280 | 1,621 | 2,230 | 1,321 | 2,264 | 2,425 | 2,741 | 2,345 | 2,092 | 1,583 | 2,337 | 2,650 |
| 2023 | 2,823 | 2,410 | 2,797 | 2,422 | 2,847 | 2,783 | 2,509 | 2,875 | 2,858 | 2,999 | 3,176 | 3,197 |
| 2024 | 3,078 | |||||||||||
| - = No Data Reported; -- = Not Applicable; NA = Not Available; W = Withheld to avoid disclosure of individual company data. |
| Release Date: 3/29/2024 |
| Next Release Date: 4/30/2024 |
Referring Pages: