|
Download Data (XLS File) |
|
||||||||
|
||||||||
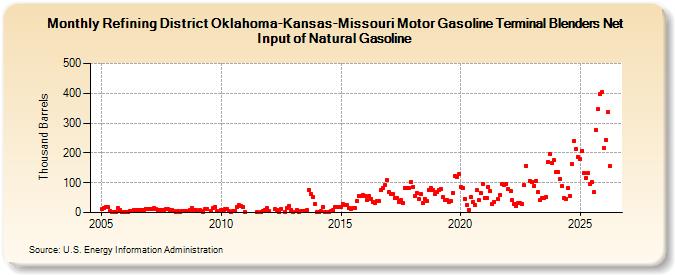
| Refining District Oklahoma-Kansas-Missouri Motor Gasoline Terminal Blenders Net Input of Natural Gasoline (Thousand Barrels) | ||||||||
| Year | Jan | Feb | Mar | Apr | May | Jun | Jul | Aug | Sep | Oct | Nov | Dec |
|---|---|---|---|---|---|---|---|---|---|---|---|---|
| 2005 | 12 | 15 | 19 | 19 | 4 | 3 | 3 | 1 | 15 | 8 | 1 | 2 |
| 2006 | 2 | 3 | 5 | 6 | 8 | 9 | 7 | 8 | 9 | 10 | 12 | 13 |
| 2007 | 12 | 11 | 14 | 11 | 8 | 7 | 7 | 9 | 11 | 12 | 9 | 7 |
| 2008 | 4 | 3 | 5 | 3 | 5 | 5 | 5 | 5 | 8 | 15 | 7 | 8 |
| 2009 | 4 | 8 | 5 | 1 | 12 | 12 | 6 | 15 | 19 | 4 | ||
| 2010 | 7 | 9 | 11 | 12 | 4 | 2 | 6 | 6 | 17 | 24 | 21 | 19 |
| 2011 | 1 | 1 | 1 | 6 | 9 | 14 | ||||||
| 2012 | 5 | 11 | 9 | 1 | 13 | 3 | 14 | 22 | 9 | |||
| 2013 | 2 | 7 | 1 | 6 | 4 | 6 | 7 | 75 | 63 | 52 | 29 | |
| 2014 | 1 | 3 | 4 | 19 | 3 | 2 | 6 | 7 | 18 | 18 | 17 | |
| 2015 | 19 | 28 | 24 | 25 | 14 | 11 | 15 | 16 | 38 | 54 | 56 | 60 |
| 2016 | 57 | 41 | 57 | 47 | 36 | 32 | 38 | 39 | 74 | 84 | 91 | 110 |
| 2017 | 69 | 63 | 62 | 48 | 49 | 37 | 42 | 32 | 83 | 84 | 84 | 102 |
| 2018 | 87 | 56 | 66 | 44 | 62 | 32 | 47 | 40 | 76 | 83 | 75 | 62 |
| 2019 | 68 | 75 | 79 | 51 | 41 | 41 | 36 | 39 | 67 | 123 | 120 | 128 |
| 2020 | 86 | 81 | 47 | 24 | 9 | 52 | 35 | 27 | 75 | 43 | 66 | 97 |
| 2021 | 48 | 48 | 87 | 71 | 28 | 37 | 44 | 59 | 95 | 92 | 95 | |
| 2022 | 79 | 72 | 42 | 30 | 22 | 31 | 31 | 30 | 91 | 157 | 106 | |
| 2023 | 102 | 90 | 107 | 68 | 42 | 48 | 48 | 51 | 171 | 195 | 166 | 175 |
| 2024 | 137 | |||||||||||
| - = No Data Reported; -- = Not Applicable; NA = Not Available; W = Withheld to avoid disclosure of individual company data. |
| Release Date: 3/29/2024 |
| Next Release Date: 4/30/2024 |