|
Download Data (XLS File) |
|
||||||||
|
||||||||
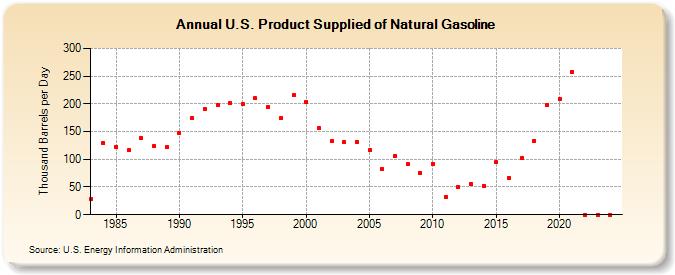
| U.S. Product Supplied of Natural Gasoline (Thousand Barrels per Day) | ||||||||
| Decade | Year-0 | Year-1 | Year-2 | Year-3 | Year-4 | Year-5 | Year-6 | Year-7 | Year-8 | Year-9 |
|---|---|---|---|---|---|---|---|---|---|---|
| 1980's | 28 | 129 | 123 | 116 | 138 | 124 | 122 | |||
| 1990's | 148 | 174 | 191 | 197 | 201 | 200 | 210 | 195 | 174 | 216 |
| 2000's | 203 | 156 | 133 | 131 | 132 | 116 | 83 | 106 | 91 | 76 |
| 2010's | 92 | 32 | 50 | 56 | 52 | 95 | 66 | 102 | 133 | 198 |
| 2020's | 209 | 258 | 0 | 0 |
| - = No Data Reported; -- = Not Applicable; NA = Not Available; W = Withheld to avoid disclosure of individual company data. |
| Release Date: 3/29/2024 |
| Next Release Date: 8/30/2024 |