|
Download Data (XLS File) |
|
||||||||
|
||||||||
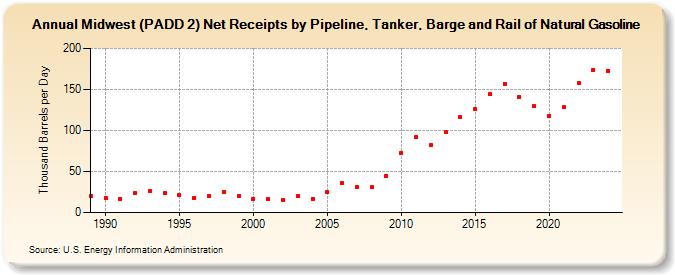
| Midwest (PADD 2) Net Receipts by Pipeline, Tanker, Barge and Rail of Natural Gasoline (Thousand Barrels per Day) | ||||||||
| Decade | Year-0 | Year-1 | Year-2 | Year-3 | Year-4 | Year-5 | Year-6 | Year-7 | Year-8 | Year-9 |
|---|---|---|---|---|---|---|---|---|---|---|
| 1980's | 20 | |||||||||
| 1990's | 18 | 16 | 24 | 26 | 24 | 21 | 18 | 20 | 25 | 20 |
| 2000's | 17 | 16 | 15 | 20 | 17 | 25 | 36 | 31 | 31 | 45 |
| 2010's | 73 | 92 | 82 | 98 | 116 | 126 | 144 | 157 | 141 | 130 |
| 2020's | 118 | 128 | 158 | 174 |
| - = No Data Reported; -- = Not Applicable; NA = Not Available; W = Withheld to avoid disclosure of individual company data. |
| Release Date: 3/29/2024 |
| Next Release Date: 8/30/2024 |