|
Download Data (XLS File) |
|
||||||||
|
||||||||
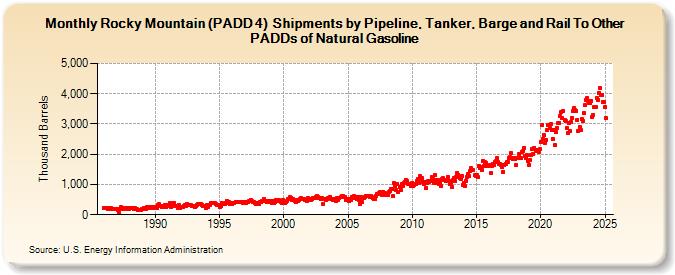
| Rocky Mountain (PADD 4) Shipments by Pipeline, Tanker, Barge and Rail To Other PADDs of Natural Gasoline (Thousand Barrels) | ||||||||
| Year | Jan | Feb | Mar | Apr | May | Jun | Jul | Aug | Sep | Oct | Nov | Dec |
|---|---|---|---|---|---|---|---|---|---|---|---|---|
| 1986 | 220 | 207 | 233 | 238 | 189 | 213 | 187 | 228 | 193 | 183 | 191 | 195 |
| 1987 | 189 | 172 | 71 | 194 | 242 | 205 | 196 | 213 | 189 | 194 | 211 | 216 |
| 1988 | 178 | 238 | 221 | 211 | 185 | 222 | 204 | 180 | 153 | 167 | 152 | 150 |
| 1989 | 180 | 179 | 212 | 187 | 246 | 208 | 237 | 247 | 231 | 252 | 254 | 238 |
| 1990 | 228 | 253 | 210 | 307 | 343 | 281 | 245 | 283 | 265 | 321 | 261 | 286 |
| 1991 | 337 | 309 | 393 | 260 | 300 | 371 | 375 | 303 | 302 | 232 | 313 | 237 |
| 1992 | 245 | 249 | 257 | 289 | 330 | 299 | 354 | 329 | 329 | 313 | 302 | 293 |
| 1993 | 295 | 247 | 300 | 327 | 362 | 355 | 350 | 348 | 333 | 298 | 286 | 222 |
| 1994 | 310 | 266 | 334 | 330 | 402 | 393 | 380 | 400 | 380 | 339 | 319 | 327 |
| 1995 | 270 | 279 | 383 | 346 | 359 | 362 | 388 | 466 | 399 | 436 | 360 | 400 |
| 1996 | 339 | 400 | 396 | 435 | 414 | 405 | 405 | 433 | 430 | 413 | 387 | 433 |
| 1997 | 390 | 372 | 430 | 425 | 454 | 499 | 449 | 435 | 431 | 388 | 340 | 398 |
| 1998 | 352 | 345 | 422 | 414 | 459 | 441 | 514 | 455 | 422 | 455 | 427 | 452 |
| 1999 | 449 | 376 | 443 | 391 | 412 | 476 | 462 | 469 | 470 | 411 | 395 | 472 |
| 2000 | 374 | 384 | 426 | 455 | 533 | 523 | 577 | 567 | 486 | 525 | 469 | 415 |
| 2001 | 498 | 463 | 473 | 516 | 539 | 520 | 520 | 511 | 485 | 503 | 465 | 547 |
| 2002 | 535 | 481 | 506 | 546 | 541 | 556 | 573 | 630 | 594 | 551 | 546 | 520 |
| 2003 | 538 | 360 | 535 | 497 | 536 | 561 | 546 | 597 | 536 | 535 | 498 | 486 |
| 2004 | 535 | 454 | 558 | 493 | 550 | 579 | 608 | 631 | 594 | 582 | 498 | 494 |
| 2005 | 516 | 454 | 516 | 488 | 592 | 549 | 624 | 581 | 520 | 571 | 496 | 363 |
| 2006 | 592 | 406 | 561 | 564 | 575 | 612 | 635 | 605 | 594 | 623 | 584 | 557 |
| 2007 | 534 | 523 | 623 | 701 | 696 | 703 | 749 | 718 | 657 | 760 | 730 | 638 |
| 2008 | 645 | 663 | 759 | 778 | 857 | 834 | 618 | 1,038 | 933 | 827 | 1,001 | 766 |
| 2009 | 932 | 807 | 1,011 | 952 | 1,065 | 1,093 | 1,137 | 1,100 | 1,025 | 1,011 | 1,011 | 960 |
| 2010 | 1,050 | 939 | 981 | 1,028 | 1,110 | 1,180 | 1,062 | 1,269 | 1,174 | 1,211 | 1,098 | 1,017 |
| 2011 | 1,075 | 885 | 1,033 | 1,111 | 1,087 | 1,112 | 1,251 | 1,172 | 1,056 | 1,312 | 1,155 | 1,036 |
| 2012 | 1,152 | 999 | 1,096 | 963 | 1,171 | 1,199 | 1,162 | 1,102 | 1,124 | 1,259 | 1,125 | 1,003 |
| 2013 | 1,044 | 916 | 1,146 | 1,203 | 1,112 | 1,240 | 1,371 | 1,323 | 1,208 | 1,193 | 1,288 | 985 |
| 2014 | 1,035 | 963 | 1,126 | 1,246 | 1,362 | 1,283 | 1,452 | 1,528 | 1,476 | 1,464 | 1,302 | 1,280 |
| 2015 | 1,324 | 1,260 | 1,600 | 1,554 | 1,586 | 1,494 | 1,780 | 1,601 | 1,732 | 1,712 | 1,606 | 1,606 |
| 2016 | 1,642 | 1,370 | 1,627 | 1,675 | 1,633 | 1,737 | 1,770 | 1,865 | 1,735 | 1,667 | 1,684 | 1,636 |
| 2017 | 1,567 | 1,423 | 1,630 | 1,680 | 1,737 | 1,754 | 1,882 | 1,903 | 2,037 | 1,889 | 1,845 | 1,864 |
| 2018 | 1,832 | 1,640 | 1,877 | 1,891 | 1,992 | 1,875 | 2,072 | 2,097 | 2,218 | 1,941 | 1,886 | 1,971 |
| 2019 | 1,789 | 1,657 | 1,825 | 1,982 | 2,180 | 2,000 | 2,222 | 2,116 | 2,142 | 2,146 | 2,088 | 2,159 |
| 2020 | 2,413 | 2,979 | 2,516 | 2,625 | 2,378 | 2,462 | 2,797 | 2,951 | 2,869 | 2,997 | 2,814 | 2,510 |
| 2021 | 2,808 | 2,299 | 2,724 | 2,869 | 3,018 | 3,031 | 3,267 | 3,380 | 3,200 | 3,434 | 3,126 | 3,095 |
| 2022 | 2,880 | 2,686 | 3,024 | 2,778 | 3,067 | 3,198 | 3,418 | 3,516 | 3,450 | 3,431 | 3,147 | 2,779 |
| 2023 | 2,911 | 2,787 | 3,156 | 3,106 | 3,355 | 3,627 | 3,799 | 3,843 | 3,771 | 3,685 | 3,684 | 3,757 |
| 2024 | 3,242 | |||||||||||
| - = No Data Reported; -- = Not Applicable; NA = Not Available; W = Withheld to avoid disclosure of individual company data. |
| Release Date: 3/29/2024 |
| Next Release Date: 4/30/2024 |