|
Download Data (XLS File) |
|
||||||||
|
||||||||
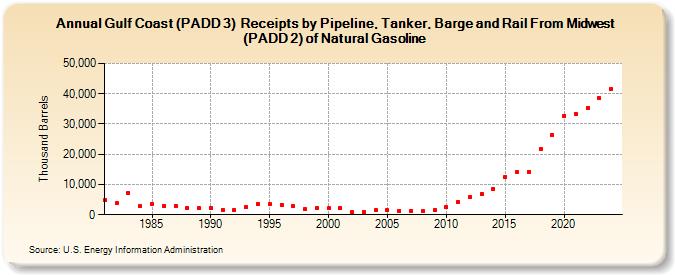
| Gulf Coast (PADD 3) Receipts by Pipeline, Tanker, Barge and Rail From Midwest (PADD 2) of Natural Gasoline (Thousand Barrels) | ||||||||
| Decade | Year-0 | Year-1 | Year-2 | Year-3 | Year-4 | Year-5 | Year-6 | Year-7 | Year-8 | Year-9 |
|---|---|---|---|---|---|---|---|---|---|---|
| 1980's | 4,740 | 3,731 | 7,228 | 2,796 | 3,542 | 2,957 | 2,959 | 2,372 | 2,114 | |
| 1990's | 2,373 | 1,660 | 1,397 | 2,491 | 3,571 | 3,387 | 3,248 | 2,794 | 1,744 | 2,174 |
| 2000's | 2,058 | 2,157 | 756 | 834 | 1,467 | 1,445 | 1,362 | 1,352 | 1,073 | 1,447 |
| 2010's | 2,470 | 4,335 | 5,780 | 6,978 | 8,462 | 12,562 | 13,960 | 14,239 | 21,703 | 26,276 |
| 2020's | 32,781 | 33,343 | 35,243 | 38,549 |
| - = No Data Reported; -- = Not Applicable; NA = Not Available; W = Withheld to avoid disclosure of individual company data. |
| Release Date: 3/29/2024 |
| Next Release Date: 8/30/2024 |