|
Download Data (XLS File) |
|
||||||||
|
||||||||
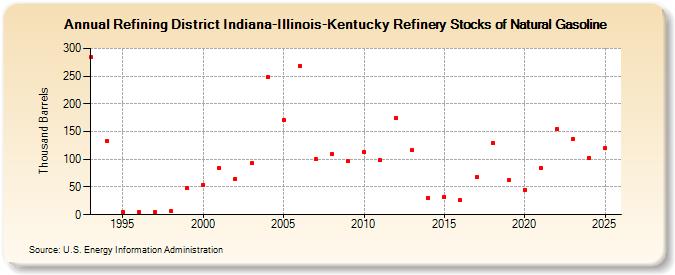
| Refining District Indiana-Illinois-Kentucky Refinery Stocks of Natural Gasoline (Thousand Barrels) | ||||||||
| Decade | Year-0 | Year-1 | Year-2 | Year-3 | Year-4 | Year-5 | Year-6 | Year-7 | Year-8 | Year-9 |
|---|---|---|---|---|---|---|---|---|---|---|
| 1990's | 284 | 133 | 4 | 4 | 4 | 6 | 48 | |||
| 2000's | 54 | 84 | 65 | 93 | 248 | 171 | 269 | 100 | 109 | 96 |
| 2010's | 113 | 98 | 175 | 116 | 31 | 32 | 26 | 68 | 130 | 62 |
| 2020's | 45 | 85 | 154 | 137 |
| - = No Data Reported; -- = Not Applicable; NA = Not Available; W = Withheld to avoid disclosure of individual company data. |
| Release Date: 3/29/2024 |
| Next Release Date: 8/30/2024 |