|
Download Data (XLS File) |
|
||||||||
|
||||||||
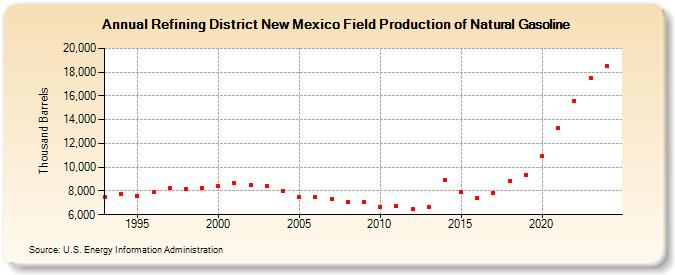
| Refining District New Mexico Field Production of Natural Gasoline (Thousand Barrels) | ||||||||
| Decade | Year-0 | Year-1 | Year-2 | Year-3 | Year-4 | Year-5 | Year-6 | Year-7 | Year-8 | Year-9 |
|---|---|---|---|---|---|---|---|---|---|---|
| 1990's | 7,522 | 7,751 | 7,572 | 7,871 | 8,238 | 8,130 | 8,253 | |||
| 2000's | 8,452 | 8,649 | 8,524 | 8,443 | 8,033 | 7,457 | 7,525 | 7,347 | 7,112 | 7,072 |
| 2010's | 6,688 | 6,755 | 6,460 | 6,679 | 8,933 | 7,934 | 7,386 | 7,869 | 8,817 | 9,354 |
| 2020's | 10,907 | 13,291 | 15,603 | 17,978 |
| - = No Data Reported; -- = Not Applicable; NA = Not Available; W = Withheld to avoid disclosure of individual company data. |
| Release Date: 3/29/2024 |
| Next Release Date: 8/30/2024 |