|
Download Data (XLS File) |
|
||||||||
|
||||||||
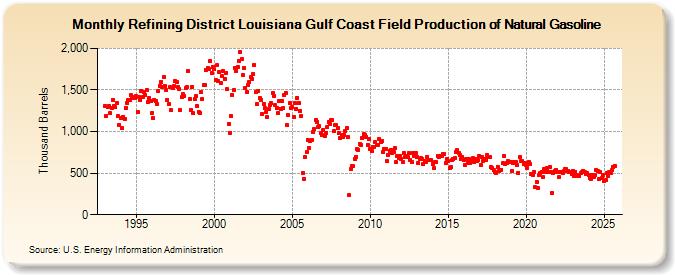
| Refining District Louisiana Gulf Coast Field Production of Natural Gasoline (Thousand Barrels) | ||||||||
| Year | Jan | Feb | Mar | Apr | May | Jun | Jul | Aug | Sep | Oct | Nov | Dec |
|---|---|---|---|---|---|---|---|---|---|---|---|---|
| 1993 | 1,309 | 1,186 | 1,301 | 1,310 | 1,220 | 1,285 | 1,382 | 1,311 | 1,291 | 1,342 | 1,189 | 1,074 |
| 1994 | 1,168 | 1,041 | 1,178 | 1,153 | 1,288 | 1,338 | 1,377 | 1,383 | 1,439 | 1,419 | 1,409 | 1,400 |
| 1995 | 1,424 | 1,241 | 1,413 | 1,374 | 1,487 | 1,416 | 1,477 | 1,440 | 1,500 | 1,358 | 1,408 | 1,362 |
| 1996 | 1,219 | 1,161 | 1,382 | 1,367 | 1,332 | 1,484 | 1,547 | 1,598 | 1,541 | 1,656 | 1,542 | 1,499 |
| 1997 | 1,384 | 1,332 | 1,530 | 1,257 | 1,522 | 1,550 | 1,609 | 1,599 | 1,535 | 1,510 | 1,255 | 1,414 |
| 1998 | 1,448 | 1,425 | 1,521 | 1,536 | 1,725 | 1,391 | 1,262 | 1,536 | 1,219 | 1,391 | 1,423 | 1,305 |
| 1999 | 1,236 | 1,222 | 1,472 | 1,390 | 1,558 | 1,557 | 1,744 | 1,763 | 1,755 | 1,853 | 1,703 | 1,782 |
| 2000 | 1,747 | 1,614 | 1,795 | 1,608 | 1,719 | 1,588 | 1,668 | 1,725 | 1,635 | 1,706 | 1,506 | 1,095 |
| 2001 | 985 | 1,183 | 1,445 | 1,498 | 1,770 | 1,734 | 1,775 | 1,850 | 1,958 | 1,873 | 1,686 | 1,759 |
| 2002 | 1,525 | 1,476 | 1,554 | 1,594 | 1,651 | 1,636 | 1,690 | 1,803 | 1,475 | 1,329 | 1,493 | 1,402 |
| 2003 | 1,381 | 1,210 | 1,331 | 1,285 | 1,231 | 1,175 | 1,266 | 1,317 | 1,339 | 1,464 | 1,426 | 1,318 |
| 2004 | 1,288 | 1,222 | 1,365 | 1,276 | 1,367 | 1,278 | 1,441 | 1,465 | 1,075 | 1,195 | 1,339 | 1,283 |
| 2005 | 1,293 | 1,179 | 1,340 | 1,275 | 1,409 | 1,343 | 1,252 | 1,184 | 501 | 432 | 692 | 754 |
| 2006 | 895 | 806 | 890 | 902 | 991 | 1,028 | 1,141 | 1,119 | 1,050 | 1,063 | 977 | 957 |
| 2007 | 1,019 | 945 | 987 | 1,050 | 1,112 | 1,087 | 1,133 | 1,139 | 1,005 | 1,073 | 1,075 | 1,042 |
| 2008 | 980 | 928 | 956 | 934 | 957 | 1,002 | 1,044 | 932 | 234 | 547 | 581 | 580 |
| 2009 | 670 | 700 | 790 | 783 | 856 | 844 | 927 | 967 | 956 | 939 | 840 | 910 |
| 2010 | 788 | 770 | 818 | 818 | 870 | 844 | 840 | 906 | 876 | 889 | 759 | 793 |
| 2011 | 796 | 640 | 724 | 768 | 783 | 745 | 757 | 799 | 628 | 707 | 682 | 706 |
| 2012 | 673 | 635 | 741 | 689 | 711 | 691 | 739 | 658 | 630 | 743 | 707 | 746 |
| 2013 | 690 | 621 | 673 | 677 | 668 | 608 | 651 | 634 | 692 | 657 | 662 | 657 |
| 2014 | 609 | 557 | 631 | 629 | 704 | 700 | 707 | 704 | 733 | 730 | 623 | 674 |
| 2015 | 641 | 558 | 579 | 653 | 670 | 676 | 756 | 775 | 744 | 717 | 667 | 695 |
| 2016 | 658 | 600 | 673 | 622 | 665 | 626 | 656 | 677 | 638 | 674 | 644 | 658 |
| 2017 | 704 | 597 | 692 | 649 | 665 | 654 | 714 | 693 | 691 | 568 | 561 | 532 |
| 2018 | 512 | 504 | 577 | 524 | 540 | 543 | 618 | 707 | 609 | 623 | 641 | 636 |
| 2019 | 636 | 529 | 627 | 639 | 635 | 601 | 507 | 692 | 643 | 644 | 611 | 627 |
| 2020 | 596 | 564 | 635 | 607 | 486 | 481 | 517 | 329 | 399 | 316 | 480 | 499 |
| 2021 | 511 | 456 | 548 | 511 | 563 | 516 | 576 | 518 | 262 | 504 | 529 | 539 |
| 2022 | 514 | 449 | 514 | 512 | 501 | 523 | 554 | 544 | 521 | 508 | 514 | 490 |
| 2023 | 529 | 461 | 514 | 477 | 471 | 778 | 498 | 513 | 528 | 516 | 486 | 500 |
| 2024 | 479 | |||||||||||
| - = No Data Reported; -- = Not Applicable; NA = Not Available; W = Withheld to avoid disclosure of individual company data. |
| Release Date: 3/29/2024 |
| Next Release Date: 4/30/2024 |