|
Download Data (XLS File) |
|
||||||||
|
||||||||
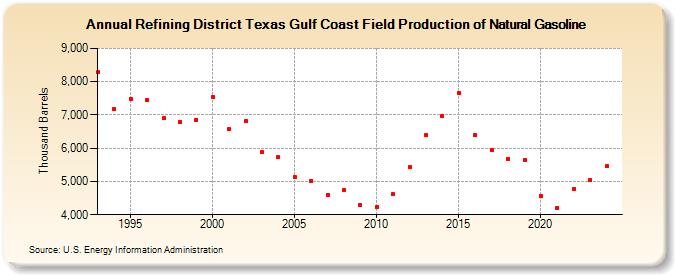
| Refining District Texas Gulf Coast Field Production of Natural Gasoline (Thousand Barrels) | ||||||||
| Decade | Year-0 | Year-1 | Year-2 | Year-3 | Year-4 | Year-5 | Year-6 | Year-7 | Year-8 | Year-9 |
|---|---|---|---|---|---|---|---|---|---|---|
| 1990's | 8,286 | 7,173 | 7,490 | 7,454 | 6,897 | 6,802 | 6,862 | |||
| 2000's | 7,544 | 6,580 | 6,812 | 5,875 | 5,721 | 5,140 | 5,021 | 4,588 | 4,729 | 4,280 |
| 2010's | 4,239 | 4,608 | 5,433 | 6,383 | 6,964 | 7,658 | 6,388 | 5,935 | 5,685 | 5,653 |
| 2020's | 4,572 | 4,207 | 4,779 | 5,010 |
| - = No Data Reported; -- = Not Applicable; NA = Not Available; W = Withheld to avoid disclosure of individual company data. |
| Release Date: 3/29/2024 |
| Next Release Date: 8/30/2024 |