|
Download Data (XLS File) |
|
||||||||
|
||||||||
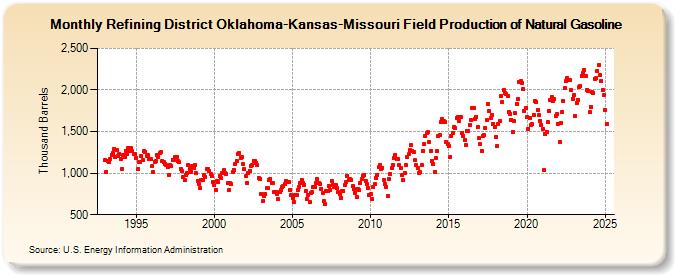
| Refining District Oklahoma-Kansas-Missouri Field Production of Natural Gasoline (Thousand Barrels) | ||||||||
| Year | Jan | Feb | Mar | Apr | May | Jun | Jul | Aug | Sep | Oct | Nov | Dec |
|---|---|---|---|---|---|---|---|---|---|---|---|---|
| 1993 | 1,157 | 1,019 | 1,148 | 1,132 | 1,168 | 1,216 | 1,243 | 1,294 | 1,190 | 1,281 | 1,203 | 1,234 |
| 1994 | 1,166 | 1,050 | 1,219 | 1,190 | 1,265 | 1,233 | 1,300 | 1,267 | 1,298 | 1,263 | 1,226 | 1,226 |
| 1995 | 1,185 | 1,045 | 1,134 | 1,138 | 1,205 | 1,157 | 1,271 | 1,257 | 1,204 | 1,214 | 1,167 | 1,165 |
| 1996 | 1,080 | 1,010 | 1,134 | 1,141 | 1,213 | 1,198 | 1,240 | 1,252 | 1,143 | 1,137 | 1,114 | 1,098 |
| 1997 | 1,070 | 983 | 1,102 | 1,088 | 1,161 | 1,160 | 1,193 | 1,192 | 1,141 | 1,128 | 1,052 | 1,028 |
| 1998 | 956 | 915 | 978 | 999 | 1,097 | 1,052 | 1,019 | 1,090 | 1,066 | 1,098 | 1,000 | 911 |
| 1999 | 867 | 823 | 915 | 917 | 974 | 954 | 1,054 | 1,054 | 1,020 | 995 | 960 | 899 |
| 2000 | 852 | 797 | 904 | 891 | 964 | 941 | 1,002 | 1,033 | 1,001 | 995 | 883 | 793 |
| 2001 | 877 | 869 | 1,013 | 1,043 | 1,105 | 1,148 | 1,230 | 1,244 | 1,186 | 1,192 | 1,110 | 1,048 |
| 2002 | 961 | 887 | 1,002 | 1,027 | 1,090 | 1,093 | 1,148 | 1,149 | 1,122 | 1,092 | 945 | 925 |
| 2003 | 755 | 659 | 720 | 751 | 818 | 822 | 921 | 931 | 882 | 887 | 770 | 771 |
| 2004 | 750 | 683 | 774 | 794 | 829 | 846 | 871 | 903 | 894 | 891 | 797 | 738 |
| 2005 | 695 | 650 | 737 | 741 | 796 | 832 | 881 | 919 | 883 | 863 | 781 | 686 |
| 2006 | 739 | 652 | 762 | 770 | 829 | 833 | 885 | 928 | 878 | 873 | 815 | 757 |
| 2007 | 662 | 626 | 782 | 780 | 851 | 795 | 905 | 862 | 829 | 852 | 827 | 777 |
| 2008 | 753 | 701 | 783 | 784 | 855 | 898 | 970 | 918 | 932 | 918 | 844 | 810 |
| 2009 | 767 | 711 | 808 | 800 | 879 | 924 | 967 | 975 | 910 | 864 | 818 | 741 |
| 2010 | 749 | 686 | 830 | 869 | 946 | 983 | 1,070 | 1,100 | 1,055 | 1,066 | 916 | 873 |
| 2011 | 834 | 725 | 924 | 991 | 1,056 | 1,098 | 1,183 | 1,222 | 1,170 | 1,165 | 1,092 | 1,064 |
| 2012 | 978 | 917 | 1,000 | 1,099 | 1,196 | 1,227 | 1,279 | 1,337 | 1,269 | 1,254 | 1,154 | 1,096 |
| 2013 | 1,065 | 996 | 1,015 | 1,096 | 1,266 | 1,354 | 1,452 | 1,480 | 1,490 | 1,376 | 1,265 | 1,151 |
| 2014 | 1,107 | 1,016 | 1,186 | 1,266 | 1,451 | 1,457 | 1,609 | 1,646 | 1,629 | 1,614 | 1,380 | 1,350 |
| 2015 | 1,327 | 1,195 | 1,450 | 1,481 | 1,555 | 1,537 | 1,662 | 1,677 | 1,631 | 1,678 | 1,487 | 1,449 |
| 2016 | 1,398 | 1,343 | 1,508 | 1,508 | 1,581 | 1,636 | 1,788 | 1,778 | 1,652 | 1,681 | 1,560 | 1,419 |
| 2017 | 1,347 | 1,270 | 1,447 | 1,457 | 1,546 | 1,643 | 1,826 | 1,743 | 1,663 | 1,703 | 1,594 | 1,553 |
| 2018 | 1,437 | 1,329 | 1,591 | 1,622 | 1,927 | 1,858 | 1,997 | 1,968 | 1,947 | 1,932 | 1,739 | 1,709 |
| 2019 | 1,642 | 1,499 | 1,625 | 1,718 | 1,831 | 1,892 | 2,096 | 2,107 | 2,085 | 2,009 | 1,744 | 1,783 |
| 2020 | 1,678 | 1,536 | 1,663 | 1,583 | 1,589 | 1,704 | 1,870 | 1,855 | 1,761 | 1,702 | 1,625 | 1,580 |
| 2021 | 1,527 | 1,036 | 1,467 | 1,496 | 1,611 | 1,753 | 1,877 | 1,920 | 1,864 | 1,888 | 1,688 | 1,707 |
| 2022 | 1,593 | 1,380 | 1,607 | 1,735 | 1,868 | 2,018 | 2,107 | 2,140 | 2,124 | 2,116 | 1,994 | 1,895 |
| 2023 | 1,791 | 1,617 | 1,768 | 1,819 | 2,052 | 1,902 | 2,018 | 2,229 | 2,246 | 2,204 | 2,002 | 1,963 |
| 2024 | 1,733 | |||||||||||
| - = No Data Reported; -- = Not Applicable; NA = Not Available; W = Withheld to avoid disclosure of individual company data. |
| Release Date: 3/29/2024 |
| Next Release Date: 4/30/2024 |