|
Download Data (XLS File) |
|
||||||||
|
||||||||
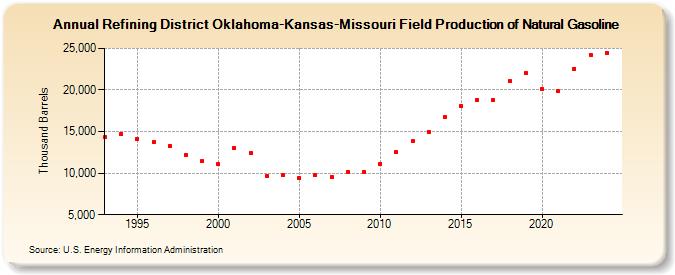
| Refining District Oklahoma-Kansas-Missouri Field Production of Natural Gasoline (Thousand Barrels) | ||||||||
| Decade | Year-0 | Year-1 | Year-2 | Year-3 | Year-4 | Year-5 | Year-6 | Year-7 | Year-8 | Year-9 |
|---|---|---|---|---|---|---|---|---|---|---|
| 1990's | 14,285 | 14,703 | 14,142 | 13,760 | 13,298 | 12,181 | 11,432 | |||
| 2000's | 11,056 | 13,065 | 12,441 | 9,687 | 9,770 | 9,464 | 9,721 | 9,548 | 10,166 | 10,164 |
| 2010's | 11,143 | 12,524 | 13,806 | 15,006 | 16,711 | 18,129 | 18,852 | 18,792 | 21,056 | 22,031 |
| 2020's | 20,146 | 19,834 | 22,577 | 23,611 |
| - = No Data Reported; -- = Not Applicable; NA = Not Available; W = Withheld to avoid disclosure of individual company data. |
| Release Date: 3/29/2024 |
| Next Release Date: 8/30/2024 |