|
Download Data (XLS File) |
|
||||||||
|
||||||||
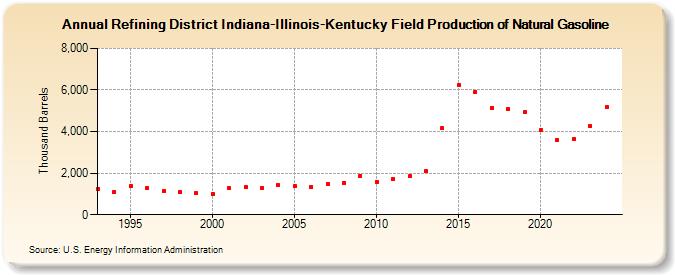
| Refining District Indiana-Illinois-Kentucky Field Production of Natural Gasoline (Thousand Barrels) | ||||||||
| Decade | Year-0 | Year-1 | Year-2 | Year-3 | Year-4 | Year-5 | Year-6 | Year-7 | Year-8 | Year-9 |
|---|---|---|---|---|---|---|---|---|---|---|
| 1990's | 1,238 | 1,114 | 1,389 | 1,270 | 1,147 | 1,082 | 1,033 | |||
| 2000's | 1,014 | 1,267 | 1,324 | 1,305 | 1,423 | 1,371 | 1,335 | 1,476 | 1,549 | 1,884 |
| 2010's | 1,592 | 1,724 | 1,840 | 2,084 | 4,158 | 6,235 | 5,918 | 5,136 | 5,077 | 4,922 |
| 2020's | 4,066 | 3,592 | 3,644 | 4,276 |
| - = No Data Reported; -- = Not Applicable; NA = Not Available; W = Withheld to avoid disclosure of individual company data. |
| Release Date: 3/29/2024 |
| Next Release Date: 8/30/2024 |