|
Download Data (XLS File) |
|
||||||||
|
||||||||
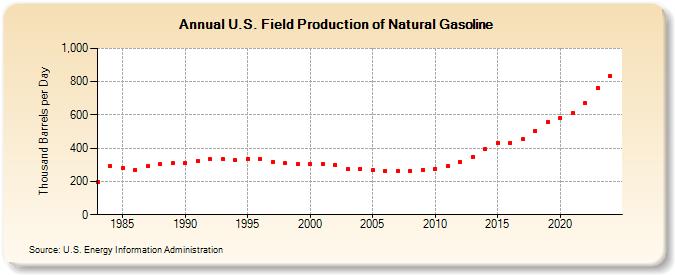
| U.S. Field Production of Natural Gasoline (Thousand Barrels per Day) | ||||||||
| Decade | Year-0 | Year-1 | Year-2 | Year-3 | Year-4 | Year-5 | Year-6 | Year-7 | Year-8 | Year-9 |
|---|---|---|---|---|---|---|---|---|---|---|
| 1980's | 197 | 292 | 282 | 269 | 291 | 302 | 309 | |||
| 1990's | 309 | 324 | 332 | 334 | 326 | 335 | 336 | 318 | 309 | 303 |
| 2000's | 306 | 307 | 300 | 275 | 277 | 266 | 263 | 263 | 264 | 271 |
| 2010's | 277 | 291 | 317 | 347 | 394 | 434 | 434 | 453 | 504 | 557 |
| 2020's | 584 | 609 | 669 | 744 |
| - = No Data Reported; -- = Not Applicable; NA = Not Available; W = Withheld to avoid disclosure of individual company data. |
| Release Date: 3/29/2024 |
| Next Release Date: 8/30/2024 |