|
Download Data (XLS File) |
|
||||||||
|
||||||||
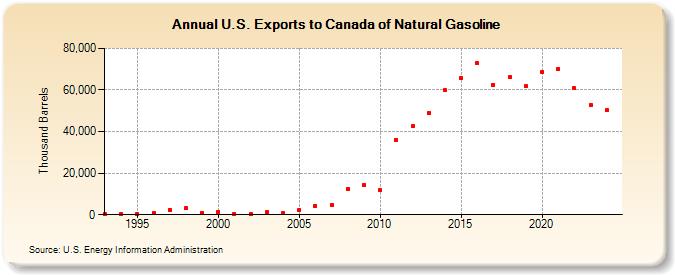
| U.S. Exports to Canada of Natural Gasoline (Thousand Barrels) | ||||||||
| Decade | Year-0 | Year-1 | Year-2 | Year-3 | Year-4 | Year-5 | Year-6 | Year-7 | Year-8 | Year-9 |
|---|---|---|---|---|---|---|---|---|---|---|
| 1990's | 243 | 339 | 238 | 854 | 2,480 | 3,068 | 1,038 | |||
| 2000's | 1,266 | 561 | 124 | 1,066 | 839 | 2,383 | 4,161 | 4,776 | 12,393 | 14,337 |
| 2010's | 11,666 | 36,103 | 42,457 | 49,026 | 59,864 | 65,958 | 72,784 | 62,567 | 66,115 | 61,679 |
| 2020's | 68,730 | 70,045 | 60,826 | 34,994 |
| - = No Data Reported; -- = Not Applicable; NA = Not Available; W = Withheld to avoid disclosure of individual company data. |
| Release Date: 3/29/2024 |
| Next Release Date: 8/30/2024 |