|
Download Data (XLS File) |
|
||||||||
|
||||||||
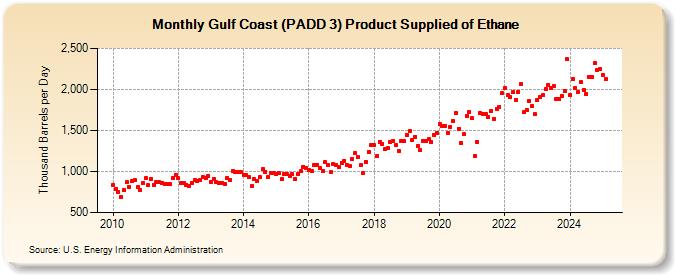
| Gulf Coast (PADD 3) Product Supplied of Ethane (Thousand Barrels per Day) | ||||||||
| Year | Jan | Feb | Mar | Apr | May | Jun | Jul | Aug | Sep | Oct | Nov | Dec |
|---|---|---|---|---|---|---|---|---|---|---|---|---|
| 2010 | 838 | 786 | 752 | 694 | 775 | 869 | 815 | 880 | 898 | 812 | 774 | 861 |
| 2011 | 916 | 832 | 909 | 840 | 875 | 869 | 864 | 850 | 853 | 844 | 922 | 962 |
| 2012 | 916 | 855 | 866 | 840 | 828 | 864 | 892 | 887 | 900 | 928 | 916 | 943 |
| 2013 | 876 | 914 | 872 | 858 | 865 | 843 | 924 | 902 | 1,007 | 996 | 994 | 990 |
| 2014 | 963 | 962 | 929 | 825 | 905 | 884 | 928 | 1,028 | 995 | 938 | 986 | 984 |
| 2015 | 969 | 978 | 907 | 967 | 965 | 951 | 966 | 907 | 968 | 1,001 | 1,060 | 1,041 |
| 2016 | 1,024 | 1,008 | 1,085 | 1,082 | 1,039 | 1,004 | 1,114 | 1,081 | 989 | 1,088 | 1,076 | 1,056 |
| 2017 | 1,104 | 1,134 | 1,083 | 1,065 | 1,149 | 1,221 | 1,174 | 1,078 | 984 | 1,120 | 1,238 | 1,320 |
| 2018 | 1,319 | 1,195 | 1,363 | 1,337 | 1,273 | 1,283 | 1,359 | 1,377 | 1,323 | 1,252 | 1,373 | 1,367 |
| 2019 | 1,444 | 1,497 | 1,387 | 1,421 | 1,312 | 1,257 | 1,376 | 1,371 | 1,393 | 1,354 | 1,449 | 1,470 |
| 2020 | 1,576 | 1,560 | 1,558 | 1,470 | 1,538 | 1,615 | 1,714 | 1,521 | 1,348 | 1,453 | 1,675 | 1,723 |
| 2021 | 1,649 | 1,190 | 1,362 | 1,710 | 1,702 | 1,699 | 1,670 | 1,738 | 1,645 | 1,763 | 1,791 | 1,954 |
| 2022 | 2,018 | 1,935 | 1,903 | 1,964 | 1,868 | 1,972 | 2,061 | 1,721 | 1,750 | 1,855 | 1,799 | 1,697 |
| 2023 | 1,801 | 1,832 | 1,860 | 1,959 | 2,045 | 2,057 | 2,038 | 1,852 | 1,835 | 1,932 | 1,972 | 2,323 |
| 2024 | 1,937 | |||||||||||
| - = No Data Reported; -- = Not Applicable; NA = Not Available; W = Withheld to avoid disclosure of individual company data. |
| Release Date: 3/29/2024 |
| Next Release Date: 4/30/2024 |