|
Download Data (XLS File) |
|
||||||||
|
||||||||
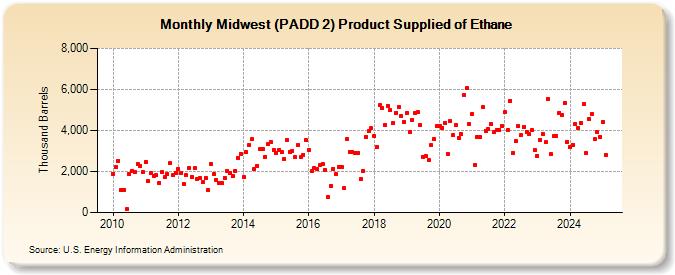
| Midwest (PADD 2) Product Supplied of Ethane (Thousand Barrels) | ||||||||
| Year | Jan | Feb | Mar | Apr | May | Jun | Jul | Aug | Sep | Oct | Nov | Dec |
|---|---|---|---|---|---|---|---|---|---|---|---|---|
| 2010 | 1,902 | 2,223 | 2,533 | 1,097 | 1,118 | 159 | 1,869 | 2,034 | 1,997 | 2,371 | 2,284 | 1,964 |
| 2011 | 2,483 | 1,527 | 1,917 | 1,782 | 1,817 | 1,457 | 1,972 | 1,737 | 1,882 | 2,394 | 1,816 | 1,935 |
| 2012 | 2,131 | 1,916 | 1,404 | 1,823 | 2,161 | 1,757 | 2,150 | 1,632 | 1,705 | 1,473 | 1,692 | 1,086 |
| 2013 | 2,385 | 1,866 | 1,606 | 1,462 | 1,424 | 1,705 | 2,037 | 1,921 | 1,762 | 2,043 | 2,682 | 2,873 |
| 2014 | 1,731 | 2,939 | 3,287 | 3,572 | 2,106 | 2,293 | 3,082 | 3,074 | 2,730 | 3,340 | 3,427 | 3,046 |
| 2015 | 2,925 | 3,050 | 2,929 | 2,603 | 3,533 | 2,939 | 3,017 | 2,690 | 3,296 | 2,689 | 2,817 | 3,530 |
| 2016 | 3,044 | 2,025 | 2,172 | 2,116 | 2,313 | 2,373 | 2,085 | 767 | 1,316 | 2,136 | 1,863 | 2,223 |
| 2017 | 2,244 | 1,178 | 3,605 | 2,970 | 2,967 | 2,890 | 2,903 | 1,612 | 2,039 | 3,703 | 3,955 | 4,105 |
| 2018 | 3,720 | 3,215 | 5,222 | 5,084 | 4,258 | 5,215 | 4,989 | 4,340 | 4,870 | 5,157 | 4,697 | 4,434 |
| 2019 | 4,868 | 3,932 | 4,528 | 4,870 | 4,892 | 4,266 | 2,730 | 2,774 | 2,570 | 3,271 | 3,592 | 4,213 |
| 2020 | 4,209 | 4,124 | 4,367 | 2,868 | 4,464 | 3,766 | 4,265 | 3,641 | 3,807 | 5,732 | 6,075 | 4,336 |
| 2021 | 4,807 | 2,322 | 3,682 | 3,661 | 5,137 | 3,992 | 4,064 | 4,309 | 3,919 | 4,018 | 4,029 | 4,223 |
| 2022 | 4,879 | 4,007 | 5,451 | 2,904 | 3,463 | 4,223 | 3,764 | 4,183 | 3,908 | 3,808 | 4,008 | 3,056 |
| 2023 | 2,781 | 3,502 | 3,262 | 3,396 | 5,509 | 2,842 | 3,728 | 3,767 | 5,086 | 4,764 | 5,206 | 3,591 |
| 2024 | 3,174 | 3,307 | 4,331 | 4,129 | ||||||||
| - = No Data Reported; -- = Not Applicable; NA = Not Available; W = Withheld to avoid disclosure of individual company data. |
| Release Date: 6/28/2024 |
| Next Release Date: 7/31/2024 |