|
Download Data (XLS File) |
|
||||||||
|
||||||||
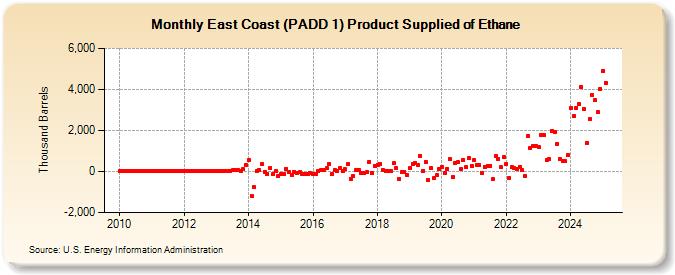
| East Coast (PADD 1) Product Supplied of Ethane (Thousand Barrels) | ||||||||
| Year | Jan | Feb | Mar | Apr | May | Jun | Jul | Aug | Sep | Oct | Nov | Dec |
|---|---|---|---|---|---|---|---|---|---|---|---|---|
| 2010 | 10 | 8 | 5 | 14 | 11 | 7 | 9 | 10 | 6 | 4 | 10 | 10 |
| 2011 | 17 | 15 | 19 | 20 | 18 | 22 | 23 | 24 | 18 | 18 | 17 | 22 |
| 2012 | 20 | 18 | 20 | 22 | 15 | 8 | 7 | 8 | 9 | 14 | 14 | 19 |
| 2013 | 18 | 16 | 24 | 23 | 20 | 27 | 58 | 73 | 74 | 43 | 108 | 324 |
| 2014 | 549 | -1,189 | -770 | 13 | 79 | 347 | -1 | -99 | 185 | -134 | 3 | -236 |
| 2015 | -132 | -103 | 139 | -5 | -168 | -8 | -74 | -36 | -123 | -138 | -141 | -81 |
| 2016 | -143 | -118 | 47 | 64 | 88 | 151 | 366 | -132 | 84 | 34 | 150 | 12 |
| 2017 | 100 | 358 | -342 | -227 | 85 | 62 | -72 | -54 | -38 | 482 | -93 | 258 |
| 2018 | 333 | 387 | 74 | 5 | 30 | 12 | 392 | 156 | -348 | -13 | -13 | -165 |
| 2019 | 176 | 361 | 436 | 324 | 775 | 44 | 487 | -400 | 150 | -338 | -173 | 103 |
| 2020 | 236 | -52 | 140 | 598 | -272 | 419 | 451 | 101 | 565 | 207 | 640 | 290 |
| 2021 | 540 | 330 | 315 | -69 | 238 | 257 | 275 | -385 | 743 | 620 | 199 | 698 |
| 2022 | 356 | -326 | 196 | 158 | 136 | 243 | 51 | -213 | 1,741 | 1,139 | 1,262 | 1,243 |
| 2023 | 1,001 | 1,936 | 1,649 | 1,940 | 490 | 1,717 | 1,721 | 1,166 | 389 | 516 | 491 | 988 |
| 2024 | 3,100 | 2,709 | 3,105 | 3,308 | ||||||||
| - = No Data Reported; -- = Not Applicable; NA = Not Available; W = Withheld to avoid disclosure of individual company data. |
| Release Date: 6/28/2024 |
| Next Release Date: 7/31/2024 |