|
Download Data (XLS File) |
|
||||||||
|
||||||||
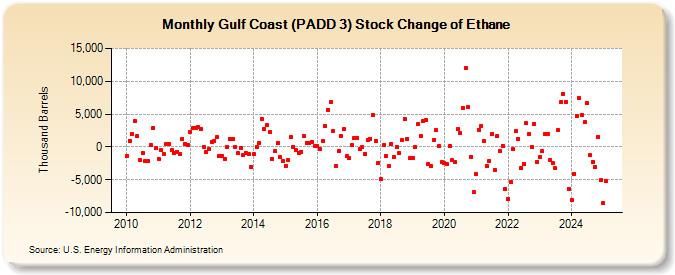
| Gulf Coast (PADD 3) Stock Change of Ethane (Thousand Barrels) | ||||||||
| Year | Jan | Feb | Mar | Apr | May | Jun | Jul | Aug | Sep | Oct | Nov | Dec |
|---|---|---|---|---|---|---|---|---|---|---|---|---|
| 2010 | -1,424 | 942 | 2,025 | 3,940 | 1,599 | -2,040 | -944 | -2,200 | -2,188 | 296 | 2,879 | -222 |
| 2011 | -1,803 | -548 | -1,063 | 422 | 376 | -513 | -977 | -721 | -1,016 | 1,249 | 505 | 337 |
| 2012 | 2,291 | 2,834 | 2,850 | 3,081 | 2,784 | 57 | -819 | -339 | 777 | 970 | 1,478 | -1,437 |
| 2013 | -1,381 | -1,796 | 26 | 1,216 | 1,135 | -39 | -942 | -228 | -1,202 | -970 | -1,087 | -3,056 |
| 2014 | -1,117 | -1 | 595 | 4,320 | 2,758 | 3,337 | 2,204 | -1,798 | -676 | 603 | -1,611 | -2,140 |
| 2015 | -2,850 | -2,060 | 1,445 | 21 | -538 | -931 | -736 | 1,610 | 552 | 582 | 807 | 97 |
| 2016 | 94 | -358 | 890 | 3,124 | 5,664 | 6,793 | 2,486 | -2,936 | -613 | 1,696 | 2,703 | -1,443 |
| 2017 | -1,735 | 250 | 1,355 | 1,413 | -397 | -23 | -1,014 | 1,045 | 1,212 | 4,848 | 955 | -2,382 |
| 2018 | -4,900 | 299 | -1,413 | -2,974 | 446 | -1,551 | -54 | -933 | 1,022 | 4,222 | 1,173 | -1,675 |
| 2019 | -1,702 | -35 | 3,435 | 1,656 | 3,906 | 4,126 | -2,601 | -2,977 | 1,107 | 2,522 | 122 | -2,306 |
| 2020 | -2,422 | -2,660 | 141 | -2,067 | -2,304 | 2,688 | 2,137 | 5,931 | 12,060 | 6,042 | -1,501 | -6,882 |
| 2021 | -4,177 | 2,628 | 3,176 | 833 | -2,870 | -2,153 | 1,962 | -3,506 | 1,599 | -666 | 197 | -6,422 |
| 2022 | -7,861 | -5,421 | -391 | 2,394 | 1,277 | -3,210 | -2,571 | 3,575 | 2,016 | 43 | 3,557 | -2,241 |
| 2023 | -1,465 | -681 | 1,988 | 2,011 | -1,985 | -2,463 | -3,284 | 2,522 | 7,527 | 7,350 | 6,876 | -6,363 |
| 2024 | -8,016 | |||||||||||
| - = No Data Reported; -- = Not Applicable; NA = Not Available; W = Withheld to avoid disclosure of individual company data. |
| Release Date: 3/29/2024 |
| Next Release Date: 4/30/2024 |
Referring Pages: