|
Download Data (XLS File) |
|
||||||||
|
||||||||
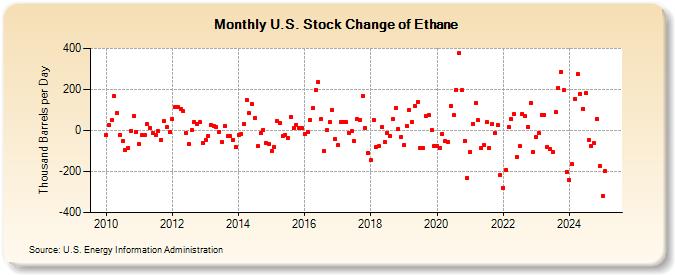
| U.S. Stock Change of Ethane (Thousand Barrels per Day) | ||||||||
| Year | Jan | Feb | Mar | Apr | May | Jun | Jul | Aug | Sep | Oct | Nov | Dec |
|---|---|---|---|---|---|---|---|---|---|---|---|---|
| 2010 | -23 | 25 | 49 | 167 | 84 | -22 | -49 | -94 | -83 | -2 | 69 | -5 |
| 2011 | -66 | -22 | -24 | 30 | 12 | -13 | -23 | -4 | -45 | 45 | 15 | -9 |
| 2012 | 56 | 116 | 112 | 107 | 93 | -12 | -68 | 1 | 41 | 32 | 40 | -59 |
| 2013 | -44 | -26 | 29 | 22 | 16 | -5 | -56 | 23 | -28 | -27 | -44 | -80 |
| 2014 | -22 | -15 | 31 | 149 | 83 | 128 | 63 | -77 | -14 | 3 | -61 | -68 |
| 2015 | -98 | -82 | 46 | 35 | -29 | -20 | -36 | 67 | 10 | 29 | 13 | 10 |
| 2016 | -15 | -8 | 50 | 109 | 197 | 235 | 55 | -100 | 2 | 42 | 101 | -43 |
| 2017 | -73 | 41 | 43 | 41 | -11 | -3 | -52 | 55 | 52 | 169 | 11 | -108 |
| 2018 | -146 | 52 | -79 | -77 | 16 | -55 | -10 | -27 | 56 | 110 | 7 | -30 |
| 2019 | -72 | 24 | 102 | 42 | 119 | 140 | -86 | -86 | 71 | 73 | 0 | -76 |
| 2020 | -74 | -83 | -17 | -52 | -54 | 121 | 74 | 198 | 376 | 196 | -51 | -231 |
| 2021 | -103 | 33 | 134 | 49 | -87 | -70 | 39 | -85 | 33 | -14 | 26 | -219 |
| 2022 | -278 | -195 | 16 | 56 | 78 | -129 | -76 | 82 | 70 | 18 | 136 | -105 |
| 2023 | -33 | -13 | 70 | 81 | -80 | -90 | -103 | 87 | 233 | 263 | 195 | -202 |
| 2024 | -242 | |||||||||||
| - = No Data Reported; -- = Not Applicable; NA = Not Available; W = Withheld to avoid disclosure of individual company data. |
| Release Date: 3/29/2024 |
| Next Release Date: 4/30/2024 |
Referring Pages: