|
Download Data (XLS File) |
|
||||||||
|
||||||||
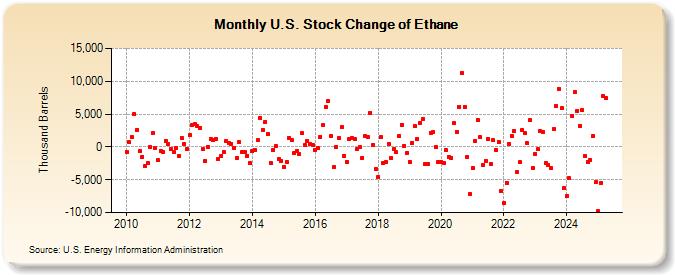
| U.S. Stock Change of Ethane (Thousand Barrels) | ||||||||
| Year | Jan | Feb | Mar | Apr | May | Jun | Jul | Aug | Sep | Oct | Nov | Dec |
|---|---|---|---|---|---|---|---|---|---|---|---|---|
| 2010 | -718 | 701 | 1,516 | 5,005 | 2,614 | -667 | -1,532 | -2,924 | -2,493 | -72 | 2,071 | -147 |
| 2011 | -2,056 | -613 | -755 | 899 | 370 | -375 | -714 | -116 | -1,336 | 1,406 | 438 | -267 |
| 2012 | 1,747 | 3,362 | 3,478 | 3,197 | 2,871 | -353 | -2,116 | 30 | 1,234 | 984 | 1,212 | -1,841 |
| 2013 | -1,354 | -724 | 891 | 648 | 503 | -150 | -1,726 | 716 | -841 | -847 | -1,311 | -2,478 |
| 2014 | -685 | -417 | 976 | 4,475 | 2,574 | 3,830 | 1,952 | -2,387 | -408 | 83 | -1,823 | -2,106 |
| 2015 | -3,030 | -2,286 | 1,415 | 1,059 | -907 | -605 | -1,117 | 2,075 | 292 | 894 | 389 | 321 |
| 2016 | -455 | -219 | 1,551 | 3,267 | 6,100 | 7,036 | 1,692 | -3,089 | 49 | 1,293 | 3,029 | -1,329 |
| 2017 | -2,254 | 1,155 | 1,341 | 1,226 | -339 | -86 | -1,623 | 1,715 | 1,571 | 5,233 | 335 | -3,349 |
| 2018 | -4,528 | 1,461 | -2,451 | -2,296 | 485 | -1,651 | -316 | -848 | 1,687 | 3,397 | 207 | -921 |
| 2019 | -2,233 | 663 | 3,169 | 1,251 | 3,679 | 4,199 | -2,662 | -2,657 | 2,131 | 2,249 | 11 | -2,356 |
| 2020 | -2,294 | -2,414 | -517 | -1,569 | -1,677 | 3,636 | 2,309 | 6,129 | 11,283 | 6,085 | -1,522 | -7,173 |
| 2021 | -3,186 | 924 | 4,142 | 1,467 | -2,709 | -2,103 | 1,222 | -2,638 | 1,001 | -433 | 783 | -6,776 |
| 2022 | -8,614 | -5,454 | 507 | 1,681 | 2,427 | -3,878 | -2,354 | 2,544 | 2,096 | 554 | 4,084 | -3,251 |
| 2023 | -1,028 | -377 | 2,158 | 2,425 | -2,480 | -2,710 | -3,187 | 2,695 | 7,003 | 8,140 | 5,858 | -6,247 |
| 2024 | -7,516 | |||||||||||
| - = No Data Reported; -- = Not Applicable; NA = Not Available; W = Withheld to avoid disclosure of individual company data. |
| Release Date: 3/29/2024 |
| Next Release Date: 4/30/2024 |
Referring Pages: