|
Download Data (XLS File) |
|
||||||||
|
||||||||
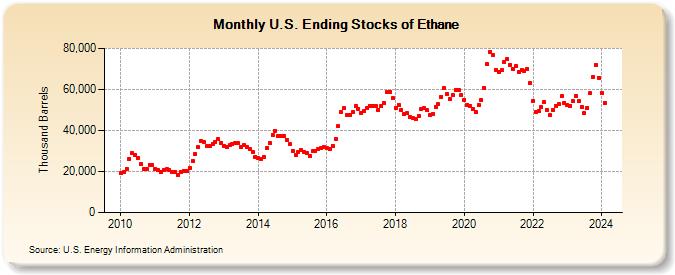
| U.S. Ending Stocks of Ethane (Thousand Barrels) | ||||||||
| Year | Jan | Feb | Mar | Apr | May | Jun | Jul | Aug | Sep | Oct | Nov | Dec |
|---|---|---|---|---|---|---|---|---|---|---|---|---|
| 2010 | 19,117 | 19,818 | 21,334 | 26,339 | 28,953 | 28,286 | 26,754 | 23,830 | 21,337 | 21,265 | 23,336 | 23,189 |
| 2011 | 21,133 | 20,520 | 19,765 | 20,664 | 21,034 | 20,659 | 19,945 | 19,829 | 18,493 | 19,899 | 20,337 | 20,070 |
| 2012 | 21,817 | 25,179 | 28,657 | 31,854 | 34,725 | 34,372 | 32,256 | 32,286 | 33,520 | 34,504 | 35,716 | 33,875 |
| 2013 | 32,521 | 31,797 | 32,688 | 33,336 | 33,839 | 33,689 | 31,963 | 32,679 | 31,838 | 30,991 | 29,680 | 27,202 |
| 2014 | 26,517 | 26,100 | 27,076 | 31,551 | 34,125 | 37,955 | 39,907 | 37,520 | 37,112 | 37,195 | 35,372 | 33,266 |
| 2015 | 30,236 | 27,950 | 29,365 | 30,424 | 29,517 | 28,912 | 27,795 | 29,870 | 30,162 | 31,056 | 31,445 | 31,766 |
| 2016 | 31,311 | 31,092 | 32,643 | 35,910 | 42,010 | 49,046 | 50,738 | 47,649 | 47,698 | 48,991 | 52,020 | 50,691 |
| 2017 | 48,437 | 49,592 | 50,933 | 52,159 | 51,820 | 51,734 | 50,111 | 51,826 | 53,397 | 58,630 | 58,965 | 55,616 |
| 2018 | 51,088 | 52,549 | 50,098 | 47,802 | 48,287 | 46,636 | 46,320 | 45,472 | 47,159 | 50,556 | 50,763 | 49,842 |
| 2019 | 47,609 | 48,272 | 51,441 | 52,692 | 56,371 | 60,570 | 57,908 | 55,251 | 57,382 | 59,631 | 59,642 | 57,286 |
| 2020 | 54,992 | 52,578 | 52,061 | 50,492 | 48,815 | 52,451 | 54,760 | 60,889 | 72,172 | 78,257 | 76,735 | 69,562 |
| 2021 | 68,324 | 69,248 | 73,390 | 74,857 | 72,148 | 70,045 | 71,267 | 68,629 | 69,630 | 69,197 | 69,980 | 63,204 |
| 2022 | 54,590 | 49,136 | 49,643 | 51,324 | 53,751 | 49,873 | 47,519 | 50,063 | 52,159 | 52,713 | 56,797 | 53,546 |
| 2023 | 52,518 | 52,141 | 54,299 | 56,724 | 54,244 | 51,534 | 48,347 | 51,042 | 58,045 | 66,185 | 72,043 | 65,796 |
| 2024 | 58,280 | |||||||||||
| - = No Data Reported; -- = Not Applicable; NA = Not Available; W = Withheld to avoid disclosure of individual company data. |
| Release Date: 3/29/2024 |
| Next Release Date: 4/30/2024 |