|
Download Data (XLS File) |
|
||||||||
|
||||||||
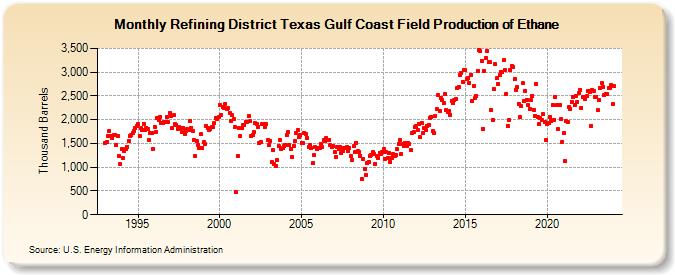
| Refining District Texas Gulf Coast Field Production of Ethane (Thousand Barrels) | ||||||||
| Year | Jan | Feb | Mar | Apr | May | Jun | Jul | Aug | Sep | Oct | Nov | Dec |
|---|---|---|---|---|---|---|---|---|---|---|---|---|
| 1993 | 1,511 | 1,531 | 1,646 | 1,768 | 1,651 | 1,612 | 1,676 | 1,683 | 1,463 | 1,666 | 1,235 | 1,059 |
| 1994 | 1,383 | 1,186 | 1,339 | 1,383 | 1,432 | 1,555 | 1,659 | 1,676 | 1,716 | 1,760 | 1,821 | 1,862 |
| 1995 | 1,908 | 1,655 | 1,815 | 1,777 | 1,915 | 1,775 | 1,831 | 1,809 | 1,580 | 1,727 | 1,720 | 1,378 |
| 1996 | 1,855 | 1,746 | 2,027 | 2,001 | 2,060 | 1,935 | 1,928 | 1,961 | 1,960 | 2,062 | 1,946 | 2,145 |
| 1997 | 2,078 | 1,828 | 2,092 | 1,908 | 1,889 | 1,810 | 1,839 | 1,825 | 1,738 | 1,826 | 1,705 | 1,766 |
| 1998 | 1,802 | 1,773 | 1,962 | 1,835 | 1,772 | 1,568 | 1,243 | 1,548 | 1,462 | 1,410 | 1,690 | 1,410 |
| 1999 | 1,524 | 1,478 | 1,877 | 1,829 | 1,789 | 1,811 | 1,853 | 1,851 | 1,923 | 2,032 | 2,005 | 2,046 |
| 2000 | 2,317 | 2,095 | 2,269 | 2,247 | 2,332 | 2,226 | 2,246 | 2,145 | 1,977 | 2,093 | 2,007 | 1,839 |
| 2001 | 471 | 1,243 | 1,819 | 1,656 | 1,821 | 1,878 | 1,893 | 1,956 | 1,954 | 2,082 | 1,964 | 1,647 |
| 2002 | 1,682 | 1,735 | 1,920 | 1,912 | 1,851 | 1,513 | 1,538 | 1,917 | 1,900 | 1,838 | 1,902 | 1,579 |
| 2003 | 1,470 | 1,559 | 1,116 | 1,355 | 1,062 | 1,031 | 1,143 | 1,451 | 1,568 | 1,393 | 1,398 | 1,444 |
| 2004 | 1,477 | 1,673 | 1,743 | 1,461 | 1,393 | 1,211 | 1,452 | 1,541 | 1,719 | 1,779 | 1,626 | 1,673 |
| 2005 | 1,519 | 1,499 | 1,725 | 1,697 | 1,618 | 1,433 | 1,474 | 1,399 | 1,079 | 1,254 | 1,415 | 1,388 |
| 2006 | 1,411 | 1,404 | 1,493 | 1,418 | 1,570 | 1,553 | 1,615 | 1,569 | 1,567 | 1,475 | 1,416 | 1,448 |
| 2007 | 1,311 | 1,221 | 1,433 | 1,373 | 1,429 | 1,300 | 1,342 | 1,412 | 1,395 | 1,415 | 1,351 | 1,414 |
| 2008 | 1,239 | 1,157 | 1,439 | 1,319 | 1,516 | 1,332 | 1,328 | 1,245 | 747 | 1,169 | 959 | 838 |
| 2009 | 1,087 | 1,115 | 1,234 | 1,248 | 1,314 | 1,279 | 1,074 | 1,246 | 1,199 | 1,307 | 1,286 | 1,326 |
| 2010 | 1,379 | 1,175 | 1,324 | 1,196 | 1,301 | 1,108 | 1,191 | 1,274 | 1,228 | 1,253 | 1,376 | 1,492 |
| 2011 | 1,562 | 1,277 | 1,485 | 1,439 | 1,513 | 1,454 | 1,505 | 1,483 | 1,355 | 1,718 | 1,732 | 1,840 |
| 2012 | 1,870 | 1,778 | 1,916 | 1,633 | 1,933 | 1,728 | 1,818 | 1,776 | 1,873 | 1,889 | 2,044 | 2,057 |
| 2013 | 1,761 | 1,710 | 2,077 | 2,229 | 2,509 | 2,187 | 2,452 | 2,414 | 2,342 | 2,533 | 2,199 | 2,168 |
| 2014 | 2,191 | 2,104 | 2,402 | 2,345 | 2,404 | 2,427 | 2,665 | 2,698 | 2,950 | 2,984 | 2,797 | 3,049 |
| 2015 | 3,049 | 2,853 | 2,871 | 2,775 | 2,946 | 2,388 | 2,710 | 2,456 | 2,499 | 3,030 | 3,473 | 3,439 |
| 2016 | 3,240 | 1,812 | 3,026 | 3,301 | 3,451 | 3,214 | 3,210 | 2,202 | 1,992 | 2,645 | 3,161 | 2,874 |
| 2017 | 2,753 | 2,930 | 3,013 | 2,997 | 3,253 | 3,036 | 2,550 | 1,871 | 1,994 | 3,036 | 3,134 | 3,103 |
| 2018 | 2,862 | 2,627 | 2,682 | 2,339 | 2,046 | 2,282 | 2,762 | 2,397 | 2,609 | 2,420 | 2,303 | 2,235 |
| 2019 | 2,404 | 2,507 | 2,213 | 2,083 | 2,748 | 2,062 | 1,908 | 2,026 | 1,985 | 2,114 | 1,957 | 1,563 |
| 2020 | 1,908 | 1,926 | 2,065 | 1,965 | 2,309 | 1,999 | 2,480 | 2,299 | 1,804 | 2,319 | 2,009 | 1,538 |
| 2021 | 1,717 | 1,122 | 1,969 | 1,959 | 2,270 | 2,231 | 2,374 | 2,478 | 2,301 | 2,508 | 2,381 | 2,558 |
| 2022 | 2,627 | 2,242 | 2,481 | 2,484 | 2,441 | 2,489 | 2,608 | 2,592 | 1,877 | 2,628 | 2,612 | 2,477 |
| 2023 | 2,487 | 2,196 | 2,417 | 2,657 | 2,767 | 2,696 | 2,525 | 2,535 | 2,536 | 2,664 | 2,657 | 2,722 |
| 2024 | 2,323 | |||||||||||
| - = No Data Reported; -- = Not Applicable; NA = Not Available; W = Withheld to avoid disclosure of individual company data. |
| Release Date: 3/29/2024 |
| Next Release Date: 4/30/2024 |