|
Download Data (XLS File) |
|
||||||||
|
||||||||
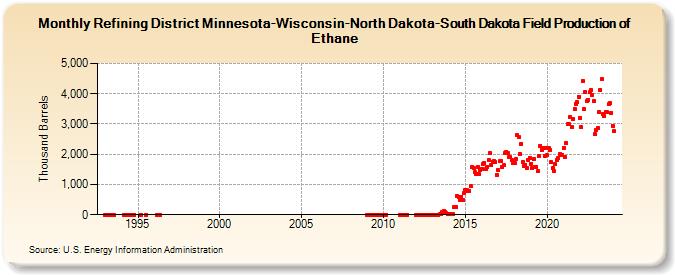
| Refining District Minnesota-Wisconsin-North Dakota-South Dakota Field Production of Ethane (Thousand Barrels) | ||||||||
| Year | Jan | Feb | Mar | Apr | May | Jun | Jul | Aug | Sep | Oct | Nov | Dec |
|---|---|---|---|---|---|---|---|---|---|---|---|---|
| 1993 | 1 | 1 | 1 | 1 | 1 | 4 | 1 | |||||
| 1994 | 1 | 1 | 1 | 1 | 1 | 1 | 1 | 1 | ||||
| 1995 | 1 | 1 | ||||||||||
| 1996 | 1 | 1 | 1 | |||||||||
| 2009 | 2 | 1 | 1 | 1 | 1 | 1 | 1 | 1 | 1 | 1 | 1 | 1 |
| 2010 | 2 | 2 | 1 | |||||||||
| 2011 | 1 | 1 | 1 | 1 | 1 | 1 | ||||||
| 2012 | 4 | 1 | 1 | 1 | 1 | 1 | 1 | 1 | 1 | 2 | 2 | 2 |
| 2013 | 3 | 3 | 2 | 1 | 4 | 13 | 17 | 77 | 121 | 92 | 41 | 12 |
| 2014 | 9 | 9 | 10 | 14 | 267 | 260 | 612 | 596 | 495 | 589 | 494 | 710 |
| 2015 | 809 | 814 | 775 | 798 | 933 | 1,586 | 1,533 | 1,397 | 1,333 | 1,584 | 1,334 | 1,465 |
| 2016 | 1,506 | 1,689 | 1,711 | 1,525 | 1,585 | 1,805 | 2,029 | 1,638 | 1,750 | 1,789 | 1,750 | 1,322 |
| 2017 | 1,471 | 1,763 | 1,766 | 1,575 | 1,634 | 2,046 | 2,075 | 2,048 | 1,902 | 1,899 | 1,810 | 1,720 |
| 2018 | 1,699 | 1,827 | 2,628 | 2,585 | 2,014 | 2,350 | 1,736 | 1,611 | 1,657 | 1,540 | 1,819 | 1,891 |
| 2019 | 1,690 | 1,537 | 1,830 | 1,584 | 1,585 | 1,439 | 1,936 | 2,288 | 2,155 | 2,218 | 1,953 | 2,200 |
| 2020 | 1,982 | 2,211 | 2,135 | 1,730 | 1,529 | 1,434 | 1,665 | 1,824 | 1,884 | 1,999 | 1,988 | 1,985 |
| 2021 | 2,208 | 1,909 | 2,366 | 2,984 | 2,990 | 3,221 | 2,900 | 3,157 | 3,499 | 3,661 | 3,716 | 3,902 |
| 2022 | 3,190 | 2,885 | 4,430 | 3,481 | 4,050 | 3,755 | 3,807 | 4,042 | 4,118 | 3,964 | 3,750 | 2,655 |
| 2023 | 2,798 | 2,878 | 3,382 | 4,124 | 4,482 | 3,319 | 3,278 | 3,382 | 3,386 | 3,652 | 3,680 | 3,362 |
| 2024 | 2,931 | |||||||||||
| - = No Data Reported; -- = Not Applicable; NA = Not Available; W = Withheld to avoid disclosure of individual company data. |
| Release Date: 3/29/2024 |
| Next Release Date: 4/30/2024 |