|
Download Data (XLS File) |
|
||||||||
|
||||||||
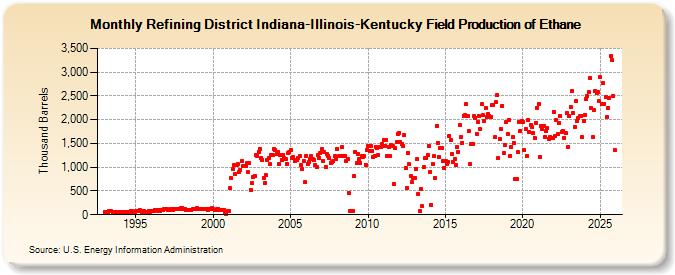
| Refining District Indiana-Illinois-Kentucky Field Production of Ethane (Thousand Barrels) | ||||||||
| Year | Jan | Feb | Mar | Apr | May | Jun | Jul | Aug | Sep | Oct | Nov | Dec |
|---|---|---|---|---|---|---|---|---|---|---|---|---|
| 1993 | 65 | 56 | 64 | 74 | 79 | 70 | 67 | 67 | 62 | 65 | 60 | 64 |
| 1994 | 65 | 52 | 65 | 61 | 52 | 44 | 58 | 63 | 68 | 72 | 54 | 51 |
| 1995 | 73 | 72 | 76 | 95 | 75 | 64 | 70 | 60 | 61 | 53 | 68 | 62 |
| 1996 | 80 | 68 | 85 | 99 | 98 | 88 | 90 | 87 | 101 | 101 | 110 | 116 |
| 1997 | 124 | 100 | 91 | 116 | 115 | 107 | 115 | 116 | 123 | 128 | 124 | 146 |
| 1998 | 144 | 123 | 130 | 106 | 98 | 109 | 103 | 99 | 110 | 117 | 125 | 138 |
| 1999 | 130 | 122 | 125 | 125 | 128 | 122 | 120 | 121 | 108 | 114 | 117 | 137 |
| 2000 | 118 | 100 | 99 | 119 | 123 | 101 | 92 | 100 | 93 | 53 | 8 | 71 |
| 2001 | 79 | 553 | 766 | 954 | 1,039 | 857 | 1,050 | 1,057 | 899 | 950 | 1,131 | 1,024 |
| 2002 | 1,021 | 1,033 | 1,082 | 889 | 1,081 | 516 | 673 | 803 | 824 | 1,252 | 1,238 | 1,328 |
| 2003 | 1,380 | 1,196 | 1,153 | 779 | 675 | 830 | 1,152 | 1,192 | 1,060 | 1,259 | 1,264 | 1,390 |
| 2004 | 1,364 | 1,270 | 1,319 | 1,070 | 1,249 | 1,158 | 1,253 | 1,191 | 1,164 | 1,074 | 1,303 | 1,319 |
| 2005 | 1,369 | 1,202 | 1,213 | 1,120 | 1,156 | 1,156 | 1,200 | 1,232 | 1,040 | 956 | 1,139 | 682 |
| 2006 | 1,243 | 1,059 | 1,107 | 1,164 | 1,230 | 1,166 | 1,160 | 1,047 | 995 | 1,250 | 1,191 | 1,306 |
| 2007 | 1,378 | 1,132 | 1,315 | 1,012 | 1,277 | 1,232 | 1,192 | 1,090 | 1,107 | 1,139 | 1,229 | 1,166 |
| 2008 | 1,390 | 1,231 | 1,230 | 1,227 | 1,416 | 1,240 | 1,244 | 1,134 | 1,173 | 450 | 85 | 83 |
| 2009 | 78 | 814 | 1,326 | 1,087 | 1,278 | 1,165 | 1,086 | 1,230 | 1,220 | 1,227 | 1,054 | 1,364 |
| 2010 | 1,436 | 1,350 | 1,452 | 1,345 | 1,216 | 1,239 | 1,432 | 1,398 | 1,253 | 1,425 | 1,415 | 1,491 |
| 2011 | 1,579 | 1,439 | 1,569 | 1,232 | 1,428 | 1,228 | 1,475 | 1,446 | 651 | 1,395 | 1,523 | 1,696 |
| 2012 | 1,724 | 1,527 | 1,498 | 1,444 | 1,670 | 978 | 567 | 1,308 | 1,061 | 813 | 678 | 778 |
| 2013 | 778 | 967 | 1,177 | 437 | 71 | 540 | 176 | 1,001 | 1,196 | 1,186 | 1,252 | 1,447 |
| 2014 | 897 | 207 | 1,077 | 1,230 | 773 | 1,868 | 1,517 | 1,220 | 1,399 | 1,412 | 1,123 | 993 |
| 2015 | 1,121 | 1,064 | 1,116 | 1,664 | 1,562 | 1,287 | 1,118 | 1,166 | 1,051 | 1,417 | 1,328 | 1,890 |
| 2016 | 1,627 | 1,519 | 2,086 | 2,091 | 2,324 | 2,077 | 1,757 | 1,068 | 1,497 | 1,480 | 2,071 | 2,045 |
| 2017 | 1,708 | 1,957 | 2,073 | 1,798 | 2,321 | 2,097 | 1,982 | 2,255 | 2,061 | 2,127 | 2,086 | 2,065 |
| 2018 | 2,303 | 2,305 | 1,627 | 2,367 | 2,512 | 1,195 | 1,596 | 1,803 | 2,294 | 1,298 | 1,461 | 1,942 |
| 2019 | 1,700 | 2,003 | 1,236 | 1,425 | 1,633 | 1,511 | 754 | 762 | 1,317 | 1,950 | 1,768 | 1,982 |
| 2020 | 1,943 | 1,359 | 1,805 | 1,245 | 1,990 | 1,738 | 1,885 | 1,842 | 1,715 | 1,622 | 1,939 | 2,254 |
| 2021 | 2,324 | 1,224 | 1,873 | 1,811 | 1,869 | 1,644 | 1,758 | 1,819 | 1,594 | 1,638 | 1,608 | 1,617 |
| 2022 | 2,167 | 1,647 | 1,984 | 1,694 | 1,927 | 2,073 | 1,746 | 1,769 | 1,623 | 1,712 | 2,144 | 1,429 |
| 2023 | 2,068 | 2,266 | 2,606 | 2,146 | 1,849 | 2,388 | 1,975 | 2,040 | 2,070 | 2,079 | 1,634 | 1,968 |
| 2024 | 2,094 | |||||||||||
| - = No Data Reported; -- = Not Applicable; NA = Not Available; W = Withheld to avoid disclosure of individual company data. |
| Release Date: 3/29/2024 |
| Next Release Date: 4/30/2024 |