|
Download Data (XLS File) |
|
||||||||
|
||||||||
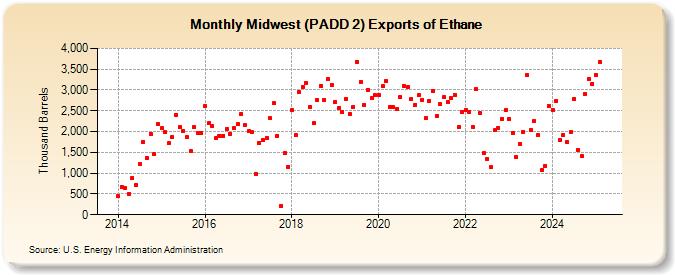
| Midwest (PADD 2) Exports of Ethane (Thousand Barrels) | ||||||||
| Year | Jan | Feb | Mar | Apr | May | Jun | Jul | Aug | Sep | Oct | Nov | Dec |
|---|---|---|---|---|---|---|---|---|---|---|---|---|
| 2014 | 445 | 676 | 650 | 507 | 891 | 722 | 1,209 | 1,759 | 1,369 | 1,951 | 1,460 | 2,181 |
| 2015 | 2,085 | 1,989 | 1,717 | 1,872 | 2,402 | 2,100 | 2,024 | 1,860 | 1,532 | 2,106 | 1,965 | 1,967 |
| 2016 | 2,610 | 2,197 | 2,125 | 1,838 | 1,893 | 1,901 | 2,065 | 1,946 | 2,089 | 2,172 | 2,422 | 2,148 |
| 2017 | 2,008 | 1,978 | 988 | 1,731 | 1,802 | 1,854 | 2,314 | 2,678 | 1,902 | 215 | 1,473 | 1,155 |
| 2018 | 2,521 | 1,907 | 2,952 | 3,083 | 3,170 | 2,601 | 2,203 | 2,770 | 3,103 | 2,766 | 3,253 | 3,123 |
| 2019 | 2,719 | 2,568 | 2,461 | 2,789 | 2,432 | 2,591 | 3,680 | 3,198 | 2,646 | 3,003 | 2,806 | 2,875 |
| 2020 | 2,884 | 3,085 | 3,221 | 2,588 | 2,582 | 2,553 | 2,826 | 3,098 | 3,063 | 2,783 | 2,648 | 2,869 |
| 2021 | 2,770 | 2,322 | 2,742 | 2,976 | 2,384 | 2,651 | 2,825 | 2,714 | 2,803 | 2,886 | 2,105 | 2,480 |
| 2022 | 2,523 | 2,480 | 2,110 | 3,021 | 2,435 | 1,478 | 1,342 | 1,145 | 2,027 | 2,097 | 2,308 | 2,517 |
| 2023 | 2,307 | 1,971 | 1,922 | 1,703 | 1,998 | 3,359 | 2,036 | 2,257 | 1,724 | 1,081 | 1,170 | 2,472 |
| 2024 | 2,530 | 2,745 | 1,802 | 1,912 | ||||||||
| - = No Data Reported; -- = Not Applicable; NA = Not Available; W = Withheld to avoid disclosure of individual company data. |
| Release Date: 6/28/2024 |
| Next Release Date: 7/31/2024 |